Immigrants from Ireland vs Immigrants from Sierra Leone Female Poverty
COMPARE
Immigrants from Ireland
Immigrants from Sierra Leone
Female Poverty
Female Poverty Comparison
Immigrants from Ireland
Immigrants from Sierra Leone
11.0%
FEMALE POVERTY
99.9/ 100
METRIC RATING
6th/ 347
METRIC RANK
13.5%
FEMALE POVERTY
43.2/ 100
METRIC RATING
184th/ 347
METRIC RANK
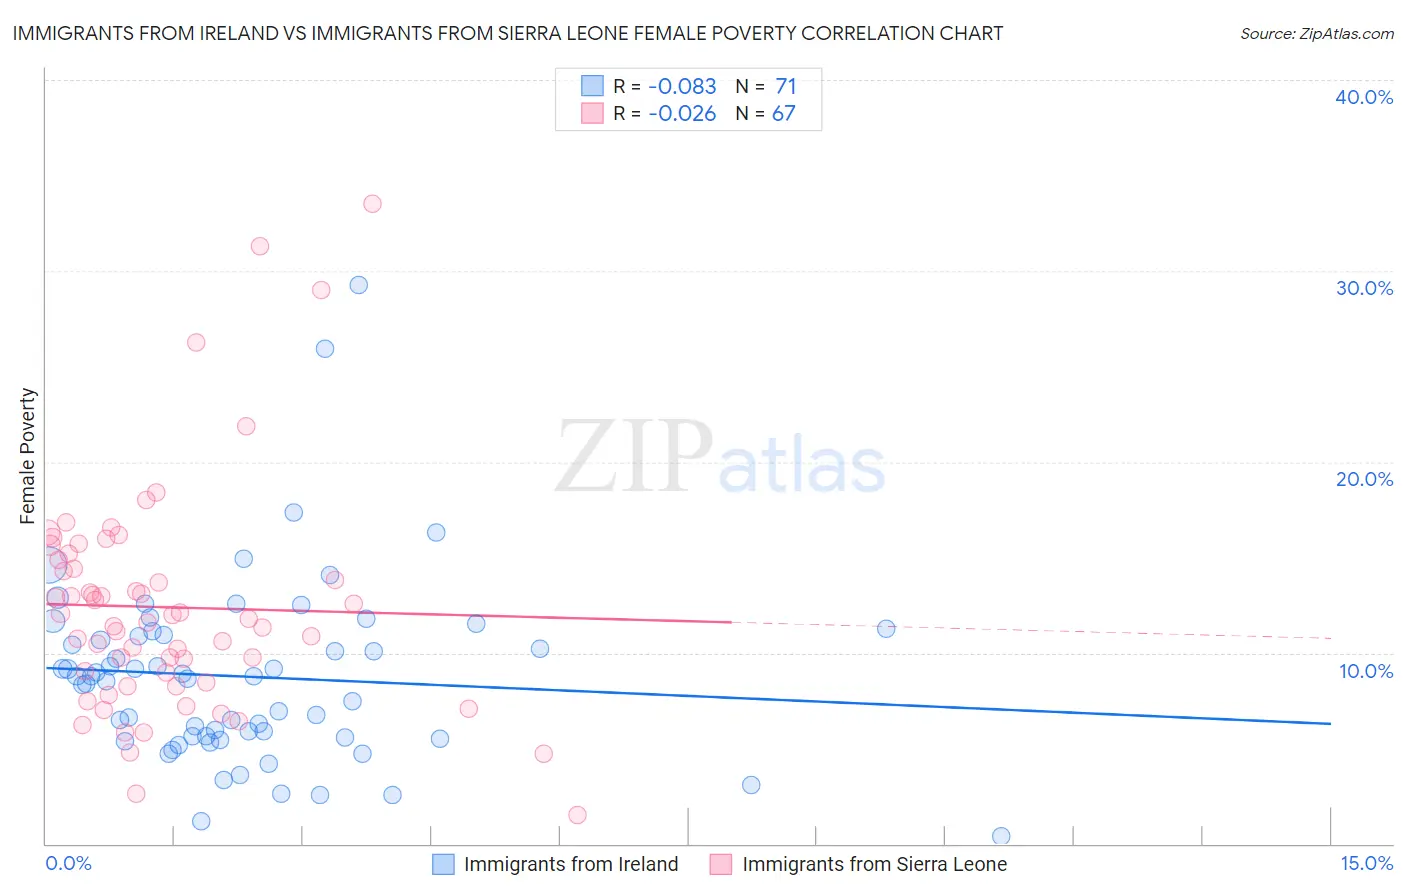
Immigrants from Ireland vs Immigrants from Sierra Leone Female Poverty Correlation Chart
The statistical analysis conducted on geographies consisting of 240,733,190 people shows a slight negative correlation between the proportion of Immigrants from Ireland and poverty level among females in the United States with a correlation coefficient (R) of -0.083 and weighted average of 11.0%. Similarly, the statistical analysis conducted on geographies consisting of 101,642,339 people shows no correlation between the proportion of Immigrants from Sierra Leone and poverty level among females in the United States with a correlation coefficient (R) of -0.026 and weighted average of 13.5%, a difference of 23.1%.
Female Poverty Correlation Summary
| Measurement | Immigrants from Ireland | Immigrants from Sierra Leone |
| Minimum | 0.42% | 1.5% |
| Maximum | 29.3% | 33.5% |
| Range | 28.9% | 32.0% |
| Mean | 8.7% | 12.4% |
| Median | 8.8% | 11.8% |
| Interquartile 25% (IQ1) | 5.6% | 8.4% |
| Interquartile 75% (IQ3) | 10.9% | 14.9% |
| Interquartile Range (IQR) | 5.3% | 6.4% |
| Standard Deviation (Sample) | 4.8% | 6.0% |
| Standard Deviation (Population) | 4.8% | 5.9% |
Similar Demographics by Female Poverty
Demographics Similar to Immigrants from Ireland by Female Poverty
In terms of female poverty, the demographic groups most similar to Immigrants from Ireland are Assyrian/Chaldean/Syriac (11.0%, a difference of 0.37%), Filipino (10.9%, a difference of 0.38%), Immigrants from South Central Asia (11.1%, a difference of 1.1%), Bulgarian (11.1%, a difference of 1.3%), and Immigrants from Hong Kong (11.2%, a difference of 2.1%).
| Demographics | Rating | Rank | Female Poverty |
| Immigrants | India | 100.0 /100 | #1 | Exceptional 9.9% |
| Chinese | 100.0 /100 | #2 | Exceptional 10.4% |
| Thais | 100.0 /100 | #3 | Exceptional 10.5% |
| Immigrants | Taiwan | 100.0 /100 | #4 | Exceptional 10.5% |
| Filipinos | 100.0 /100 | #5 | Exceptional 10.9% |
| Immigrants | Ireland | 99.9 /100 | #6 | Exceptional 11.0% |
| Assyrians/Chaldeans/Syriacs | 99.9 /100 | #7 | Exceptional 11.0% |
| Immigrants | South Central Asia | 99.9 /100 | #8 | Exceptional 11.1% |
| Bulgarians | 99.9 /100 | #9 | Exceptional 11.1% |
| Immigrants | Hong Kong | 99.9 /100 | #10 | Exceptional 11.2% |
| Maltese | 99.9 /100 | #11 | Exceptional 11.2% |
| Bhutanese | 99.9 /100 | #12 | Exceptional 11.3% |
| Immigrants | Lithuania | 99.9 /100 | #13 | Exceptional 11.3% |
| Lithuanians | 99.8 /100 | #14 | Exceptional 11.4% |
| Latvians | 99.8 /100 | #15 | Exceptional 11.4% |
Demographics Similar to Immigrants from Sierra Leone by Female Poverty
In terms of female poverty, the demographic groups most similar to Immigrants from Sierra Leone are Kenyan (13.5%, a difference of 0.060%), Immigrants from Cameroon (13.5%, a difference of 0.11%), Venezuelan (13.5%, a difference of 0.13%), Immigrants from Colombia (13.5%, a difference of 0.13%), and South American (13.5%, a difference of 0.16%).
| Demographics | Rating | Rank | Female Poverty |
| Immigrants | Morocco | 49.4 /100 | #177 | Average 13.4% |
| Israelis | 49.1 /100 | #178 | Average 13.5% |
| Immigrants | Syria | 48.8 /100 | #179 | Average 13.5% |
| South Americans | 44.8 /100 | #180 | Average 13.5% |
| Venezuelans | 44.5 /100 | #181 | Average 13.5% |
| Immigrants | Colombia | 44.5 /100 | #182 | Average 13.5% |
| Kenyans | 43.8 /100 | #183 | Average 13.5% |
| Immigrants | Sierra Leone | 43.2 /100 | #184 | Average 13.5% |
| Immigrants | Cameroon | 42.0 /100 | #185 | Average 13.5% |
| Immigrants | Portugal | 41.5 /100 | #186 | Average 13.6% |
| Immigrants | Venezuela | 41.0 /100 | #187 | Average 13.6% |
| Hawaiians | 39.9 /100 | #188 | Fair 13.6% |
| Uruguayans | 39.8 /100 | #189 | Fair 13.6% |
| Sierra Leoneans | 33.1 /100 | #190 | Fair 13.7% |
| Immigrants | Kuwait | 32.7 /100 | #191 | Fair 13.7% |