Pima vs Immigrants from Sierra Leone Unemployment
COMPARE
Pima
Immigrants from Sierra Leone
Unemployment
Unemployment Comparison
Pima
Immigrants from Sierra Leone
8.2%
UNEMPLOYMENT
0.0/ 100
METRIC RATING
338th/ 347
METRIC RANK
5.8%
UNEMPLOYMENT
0.1/ 100
METRIC RATING
268th/ 347
METRIC RANK
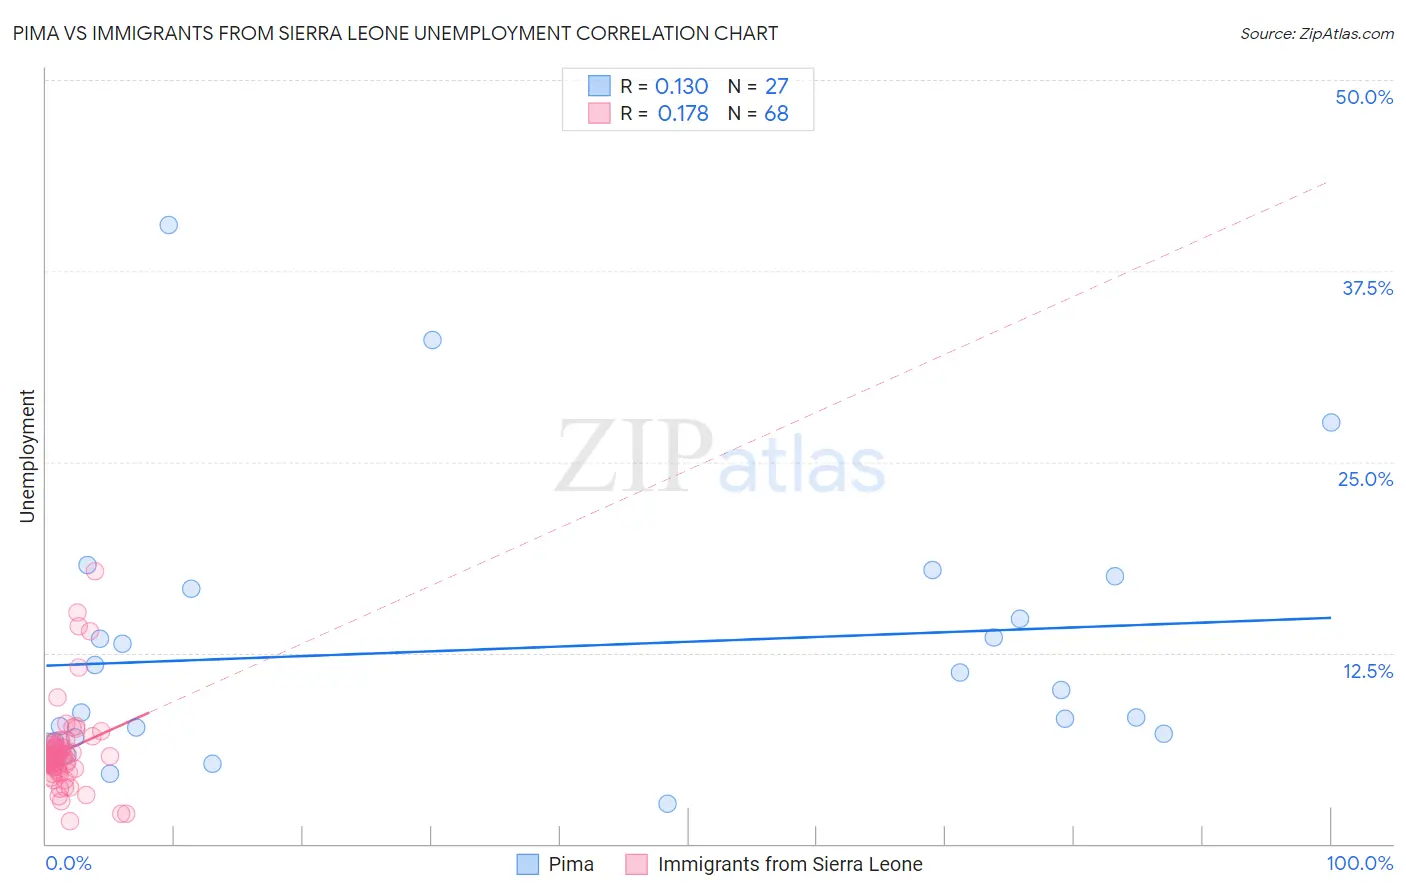
Pima vs Immigrants from Sierra Leone Unemployment Correlation Chart
The statistical analysis conducted on geographies consisting of 61,529,497 people shows a poor positive correlation between the proportion of Pima and unemployment in the United States with a correlation coefficient (R) of 0.130 and weighted average of 8.2%. Similarly, the statistical analysis conducted on geographies consisting of 101,634,526 people shows a poor positive correlation between the proportion of Immigrants from Sierra Leone and unemployment in the United States with a correlation coefficient (R) of 0.178 and weighted average of 5.8%, a difference of 40.8%.
Unemployment Correlation Summary
| Measurement | Pima | Immigrants from Sierra Leone |
| Minimum | 2.6% | 1.5% |
| Maximum | 40.5% | 17.8% |
| Range | 37.9% | 16.3% |
| Mean | 12.8% | 6.1% |
| Median | 10.1% | 5.7% |
| Interquartile 25% (IQ1) | 6.9% | 4.9% |
| Interquartile 75% (IQ3) | 16.7% | 6.5% |
| Interquartile Range (IQR) | 9.8% | 1.6% |
| Standard Deviation (Sample) | 8.9% | 2.8% |
| Standard Deviation (Population) | 8.7% | 2.8% |
Similar Demographics by Unemployment
Demographics Similar to Pima by Unemployment
In terms of unemployment, the demographic groups most similar to Pima are Navajo (8.4%, a difference of 1.6%), Puerto Rican (8.4%, a difference of 2.4%), Cheyenne (8.0%, a difference of 2.8%), Immigrants from Yemen (7.7%, a difference of 6.7%), and Alaskan Athabascan (7.7%, a difference of 7.5%).
| Demographics | Rating | Rank | Unemployment |
| Dominicans | 0.0 /100 | #331 | Tragic 7.4% |
| Sioux | 0.0 /100 | #332 | Tragic 7.4% |
| Immigrants | Dominican Republic | 0.0 /100 | #333 | Tragic 7.4% |
| Apache | 0.0 /100 | #334 | Tragic 7.4% |
| Alaskan Athabascans | 0.0 /100 | #335 | Tragic 7.7% |
| Immigrants | Yemen | 0.0 /100 | #336 | Tragic 7.7% |
| Cheyenne | 0.0 /100 | #337 | Tragic 8.0% |
| Pima | 0.0 /100 | #338 | Tragic 8.2% |
| Navajo | 0.0 /100 | #339 | Tragic 8.4% |
| Puerto Ricans | 0.0 /100 | #340 | Tragic 8.4% |
| Tohono O'odham | 0.0 /100 | #341 | Tragic 8.9% |
| Hopi | 0.0 /100 | #342 | Tragic 8.9% |
| Yuman | 0.0 /100 | #343 | Tragic 9.1% |
| Arapaho | 0.0 /100 | #344 | Tragic 9.8% |
| Inupiat | 0.0 /100 | #345 | Tragic 10.1% |
Demographics Similar to Immigrants from Sierra Leone by Unemployment
In terms of unemployment, the demographic groups most similar to Immigrants from Sierra Leone are Immigrants from El Salvador (5.8%, a difference of 0.010%), Immigrants from Nigeria (5.8%, a difference of 0.040%), Blackfeet (5.8%, a difference of 0.090%), Mexican American Indian (5.8%, a difference of 0.11%), and Mexican (5.9%, a difference of 0.32%).
| Demographics | Rating | Rank | Unemployment |
| Immigrants | Guatemala | 0.1 /100 | #261 | Tragic 5.8% |
| Sierra Leoneans | 0.1 /100 | #262 | Tragic 5.8% |
| Salvadorans | 0.1 /100 | #263 | Tragic 5.8% |
| Immigrants | Liberia | 0.1 /100 | #264 | Tragic 5.8% |
| Nigerians | 0.1 /100 | #265 | Tragic 5.8% |
| Mexican American Indians | 0.1 /100 | #266 | Tragic 5.8% |
| Immigrants | Nigeria | 0.1 /100 | #267 | Tragic 5.8% |
| Immigrants | Sierra Leone | 0.1 /100 | #268 | Tragic 5.8% |
| Immigrants | El Salvador | 0.1 /100 | #269 | Tragic 5.8% |
| Blackfeet | 0.1 /100 | #270 | Tragic 5.8% |
| Mexicans | 0.1 /100 | #271 | Tragic 5.9% |
| Hispanics or Latinos | 0.0 /100 | #272 | Tragic 5.9% |
| Immigrants | Fiji | 0.0 /100 | #273 | Tragic 5.9% |
| Bahamians | 0.0 /100 | #274 | Tragic 5.9% |
| Immigrants | Latin America | 0.0 /100 | #275 | Tragic 5.9% |