Peruvian vs Greek Female Poverty
COMPARE
Peruvian
Greek
Female Poverty
Female Poverty Comparison
Peruvians
Greeks
12.9%
FEMALE POVERTY
85.2/ 100
METRIC RATING
136th/ 347
METRIC RANK
11.7%
FEMALE POVERTY
99.5/ 100
METRIC RATING
30th/ 347
METRIC RANK
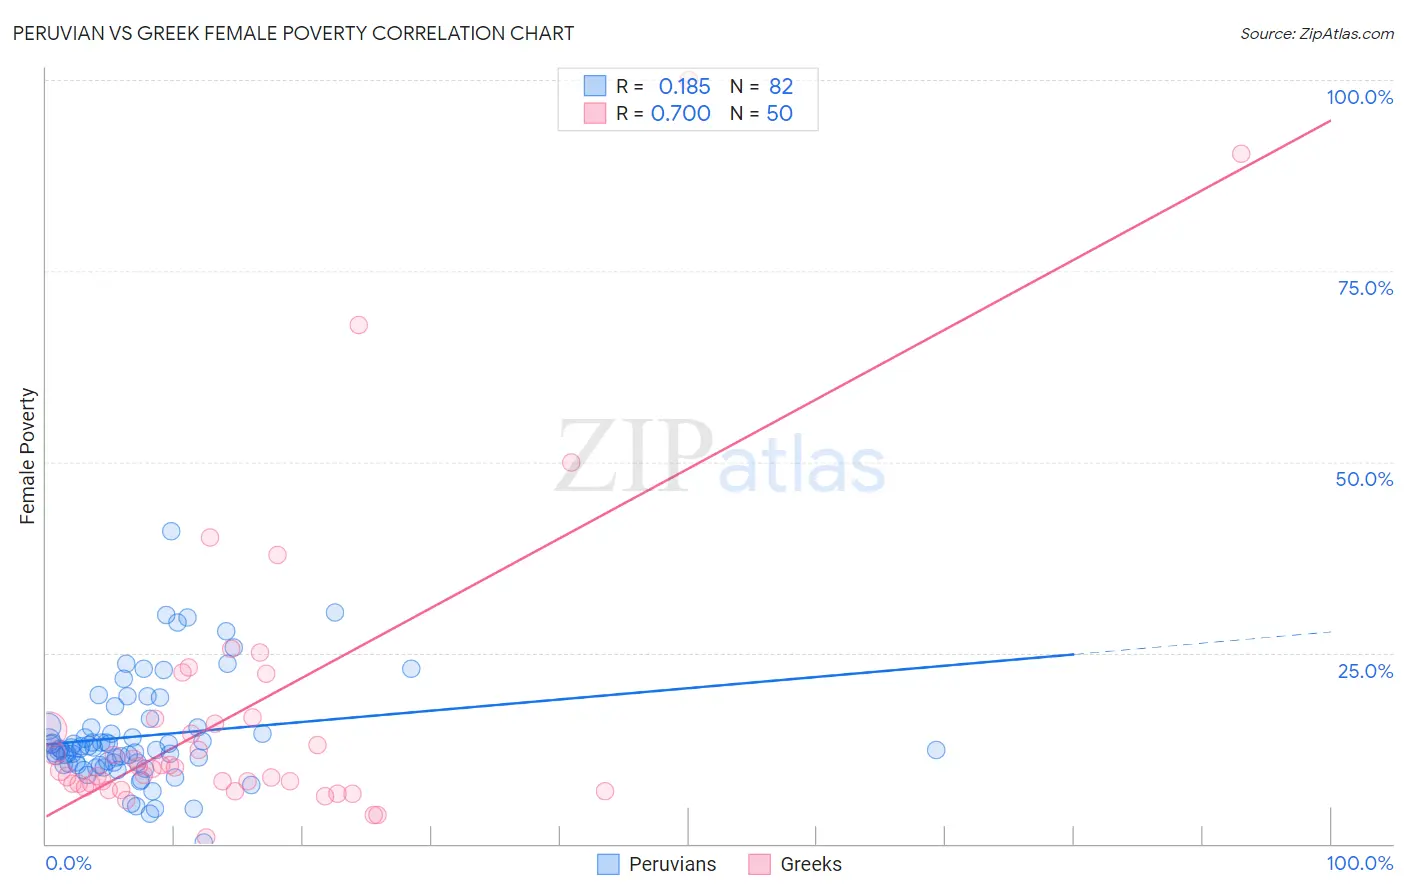
Peruvian vs Greek Female Poverty Correlation Chart
The statistical analysis conducted on geographies consisting of 362,941,638 people shows a poor positive correlation between the proportion of Peruvians and poverty level among females in the United States with a correlation coefficient (R) of 0.185 and weighted average of 12.9%. Similarly, the statistical analysis conducted on geographies consisting of 482,170,203 people shows a significant positive correlation between the proportion of Greeks and poverty level among females in the United States with a correlation coefficient (R) of 0.700 and weighted average of 11.7%, a difference of 10.0%.
Female Poverty Correlation Summary
| Measurement | Peruvian | Greek |
| Minimum | 0.21% | 0.85% |
| Maximum | 40.9% | 100.0% |
| Range | 40.7% | 99.2% |
| Mean | 14.1% | 17.3% |
| Median | 12.5% | 9.9% |
| Interquartile 25% (IQ1) | 10.5% | 7.9% |
| Interquartile 75% (IQ3) | 15.2% | 16.3% |
| Interquartile Range (IQR) | 4.8% | 8.5% |
| Standard Deviation (Sample) | 6.8% | 20.2% |
| Standard Deviation (Population) | 6.8% | 20.0% |
Similar Demographics by Female Poverty
Demographics Similar to Peruvians by Female Poverty
In terms of female poverty, the demographic groups most similar to Peruvians are French (12.9%, a difference of 0.080%), Chilean (12.9%, a difference of 0.090%), Immigrants from Switzerland (12.9%, a difference of 0.13%), Immigrants from Western Europe (12.8%, a difference of 0.30%), and Immigrants from France (12.9%, a difference of 0.31%).
| Demographics | Rating | Rank | Female Poverty |
| Immigrants | Brazil | 87.9 /100 | #129 | Excellent 12.8% |
| Immigrants | Vietnam | 87.1 /100 | #130 | Excellent 12.8% |
| Immigrants | Argentina | 87.0 /100 | #131 | Excellent 12.8% |
| Immigrants | Jordan | 86.9 /100 | #132 | Excellent 12.8% |
| Immigrants | Western Europe | 86.6 /100 | #133 | Excellent 12.8% |
| Immigrants | Switzerland | 85.8 /100 | #134 | Excellent 12.9% |
| French | 85.6 /100 | #135 | Excellent 12.9% |
| Peruvians | 85.2 /100 | #136 | Excellent 12.9% |
| Chileans | 84.7 /100 | #137 | Excellent 12.9% |
| Immigrants | France | 83.6 /100 | #138 | Excellent 12.9% |
| Basques | 83.1 /100 | #139 | Excellent 12.9% |
| Pakistanis | 83.0 /100 | #140 | Excellent 12.9% |
| Icelanders | 81.1 /100 | #141 | Excellent 13.0% |
| Brazilians | 80.5 /100 | #142 | Excellent 13.0% |
| Immigrants | Malaysia | 80.4 /100 | #143 | Excellent 13.0% |
Demographics Similar to Greeks by Female Poverty
In terms of female poverty, the demographic groups most similar to Greeks are Immigrants from North Macedonia (11.7%, a difference of 0.080%), Polish (11.7%, a difference of 0.22%), Immigrants from Korea (11.7%, a difference of 0.23%), Danish (11.7%, a difference of 0.35%), and Cypriot (11.8%, a difference of 0.42%).
| Demographics | Rating | Rank | Female Poverty |
| Burmese | 99.7 /100 | #23 | Exceptional 11.6% |
| Luxembourgers | 99.7 /100 | #24 | Exceptional 11.6% |
| Immigrants | Northern Europe | 99.6 /100 | #25 | Exceptional 11.6% |
| Croatians | 99.6 /100 | #26 | Exceptional 11.6% |
| Iranians | 99.6 /100 | #27 | Exceptional 11.7% |
| Immigrants | Korea | 99.6 /100 | #28 | Exceptional 11.7% |
| Immigrants | North Macedonia | 99.6 /100 | #29 | Exceptional 11.7% |
| Greeks | 99.5 /100 | #30 | Exceptional 11.7% |
| Poles | 99.5 /100 | #31 | Exceptional 11.7% |
| Danes | 99.5 /100 | #32 | Exceptional 11.7% |
| Cypriots | 99.5 /100 | #33 | Exceptional 11.8% |
| Immigrants | Singapore | 99.4 /100 | #34 | Exceptional 11.8% |
| Immigrants | Iran | 99.4 /100 | #35 | Exceptional 11.8% |
| Immigrants | Pakistan | 99.4 /100 | #36 | Exceptional 11.8% |
| Immigrants | Greece | 99.3 /100 | #37 | Exceptional 11.8% |