Peruvian vs Assyrian/Chaldean/Syriac Female Poverty
COMPARE
Peruvian
Assyrian/Chaldean/Syriac
Female Poverty
Female Poverty Comparison
Peruvians
Assyrians/Chaldeans/Syriacs
12.9%
FEMALE POVERTY
85.2/ 100
METRIC RATING
136th/ 347
METRIC RANK
11.0%
FEMALE POVERTY
99.9/ 100
METRIC RATING
7th/ 347
METRIC RANK
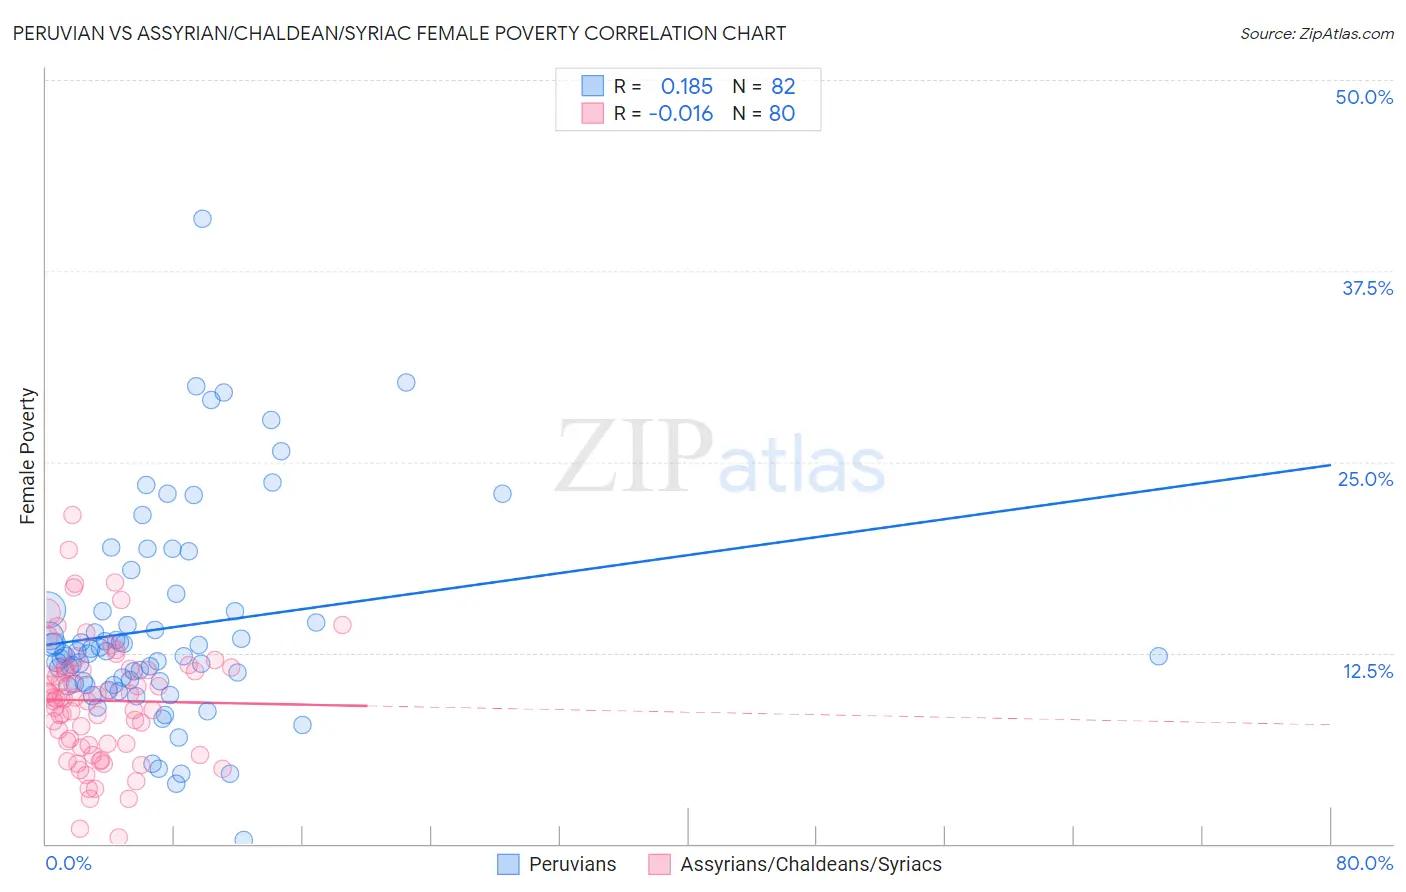
Peruvian vs Assyrian/Chaldean/Syriac Female Poverty Correlation Chart
The statistical analysis conducted on geographies consisting of 362,941,638 people shows a poor positive correlation between the proportion of Peruvians and poverty level among females in the United States with a correlation coefficient (R) of 0.185 and weighted average of 12.9%. Similarly, the statistical analysis conducted on geographies consisting of 110,294,080 people shows no correlation between the proportion of Assyrians/Chaldeans/Syriacs and poverty level among females in the United States with a correlation coefficient (R) of -0.016 and weighted average of 11.0%, a difference of 16.7%.
Female Poverty Correlation Summary
| Measurement | Peruvian | Assyrian/Chaldean/Syriac |
| Minimum | 0.21% | 0.39% |
| Maximum | 40.9% | 21.5% |
| Range | 40.7% | 21.1% |
| Mean | 14.1% | 9.4% |
| Median | 12.5% | 9.5% |
| Interquartile 25% (IQ1) | 10.5% | 6.5% |
| Interquartile 75% (IQ3) | 15.2% | 11.4% |
| Interquartile Range (IQR) | 4.8% | 4.9% |
| Standard Deviation (Sample) | 6.8% | 4.0% |
| Standard Deviation (Population) | 6.8% | 4.0% |
Similar Demographics by Female Poverty
Demographics Similar to Peruvians by Female Poverty
In terms of female poverty, the demographic groups most similar to Peruvians are French (12.9%, a difference of 0.080%), Chilean (12.9%, a difference of 0.090%), Immigrants from Switzerland (12.9%, a difference of 0.13%), Immigrants from Western Europe (12.8%, a difference of 0.30%), and Immigrants from France (12.9%, a difference of 0.31%).
| Demographics | Rating | Rank | Female Poverty |
| Immigrants | Brazil | 87.9 /100 | #129 | Excellent 12.8% |
| Immigrants | Vietnam | 87.1 /100 | #130 | Excellent 12.8% |
| Immigrants | Argentina | 87.0 /100 | #131 | Excellent 12.8% |
| Immigrants | Jordan | 86.9 /100 | #132 | Excellent 12.8% |
| Immigrants | Western Europe | 86.6 /100 | #133 | Excellent 12.8% |
| Immigrants | Switzerland | 85.8 /100 | #134 | Excellent 12.9% |
| French | 85.6 /100 | #135 | Excellent 12.9% |
| Peruvians | 85.2 /100 | #136 | Excellent 12.9% |
| Chileans | 84.7 /100 | #137 | Excellent 12.9% |
| Immigrants | France | 83.6 /100 | #138 | Excellent 12.9% |
| Basques | 83.1 /100 | #139 | Excellent 12.9% |
| Pakistanis | 83.0 /100 | #140 | Excellent 12.9% |
| Icelanders | 81.1 /100 | #141 | Excellent 13.0% |
| Brazilians | 80.5 /100 | #142 | Excellent 13.0% |
| Immigrants | Malaysia | 80.4 /100 | #143 | Excellent 13.0% |
Demographics Similar to Assyrians/Chaldeans/Syriacs by Female Poverty
In terms of female poverty, the demographic groups most similar to Assyrians/Chaldeans/Syriacs are Immigrants from Ireland (11.0%, a difference of 0.37%), Immigrants from South Central Asia (11.1%, a difference of 0.70%), Filipino (10.9%, a difference of 0.75%), Bulgarian (11.1%, a difference of 0.89%), and Immigrants from Hong Kong (11.2%, a difference of 1.7%).
| Demographics | Rating | Rank | Female Poverty |
| Immigrants | India | 100.0 /100 | #1 | Exceptional 9.9% |
| Chinese | 100.0 /100 | #2 | Exceptional 10.4% |
| Thais | 100.0 /100 | #3 | Exceptional 10.5% |
| Immigrants | Taiwan | 100.0 /100 | #4 | Exceptional 10.5% |
| Filipinos | 100.0 /100 | #5 | Exceptional 10.9% |
| Immigrants | Ireland | 99.9 /100 | #6 | Exceptional 11.0% |
| Assyrians/Chaldeans/Syriacs | 99.9 /100 | #7 | Exceptional 11.0% |
| Immigrants | South Central Asia | 99.9 /100 | #8 | Exceptional 11.1% |
| Bulgarians | 99.9 /100 | #9 | Exceptional 11.1% |
| Immigrants | Hong Kong | 99.9 /100 | #10 | Exceptional 11.2% |
| Maltese | 99.9 /100 | #11 | Exceptional 11.2% |
| Bhutanese | 99.9 /100 | #12 | Exceptional 11.3% |
| Immigrants | Lithuania | 99.9 /100 | #13 | Exceptional 11.3% |
| Lithuanians | 99.8 /100 | #14 | Exceptional 11.4% |
| Latvians | 99.8 /100 | #15 | Exceptional 11.4% |