Immigrants from Uzbekistan vs Immigrants from Poland Receiving Food Stamps
COMPARE
Immigrants from Uzbekistan
Immigrants from Poland
Receiving Food Stamps
Receiving Food Stamps Comparison
Immigrants from Uzbekistan
Immigrants from Poland
14.3%
RECEIVING FOOD STAMPS
0.2/ 100
METRIC RATING
264th/ 347
METRIC RANK
10.6%
RECEIVING FOOD STAMPS
93.9/ 100
METRIC RATING
119th/ 347
METRIC RANK
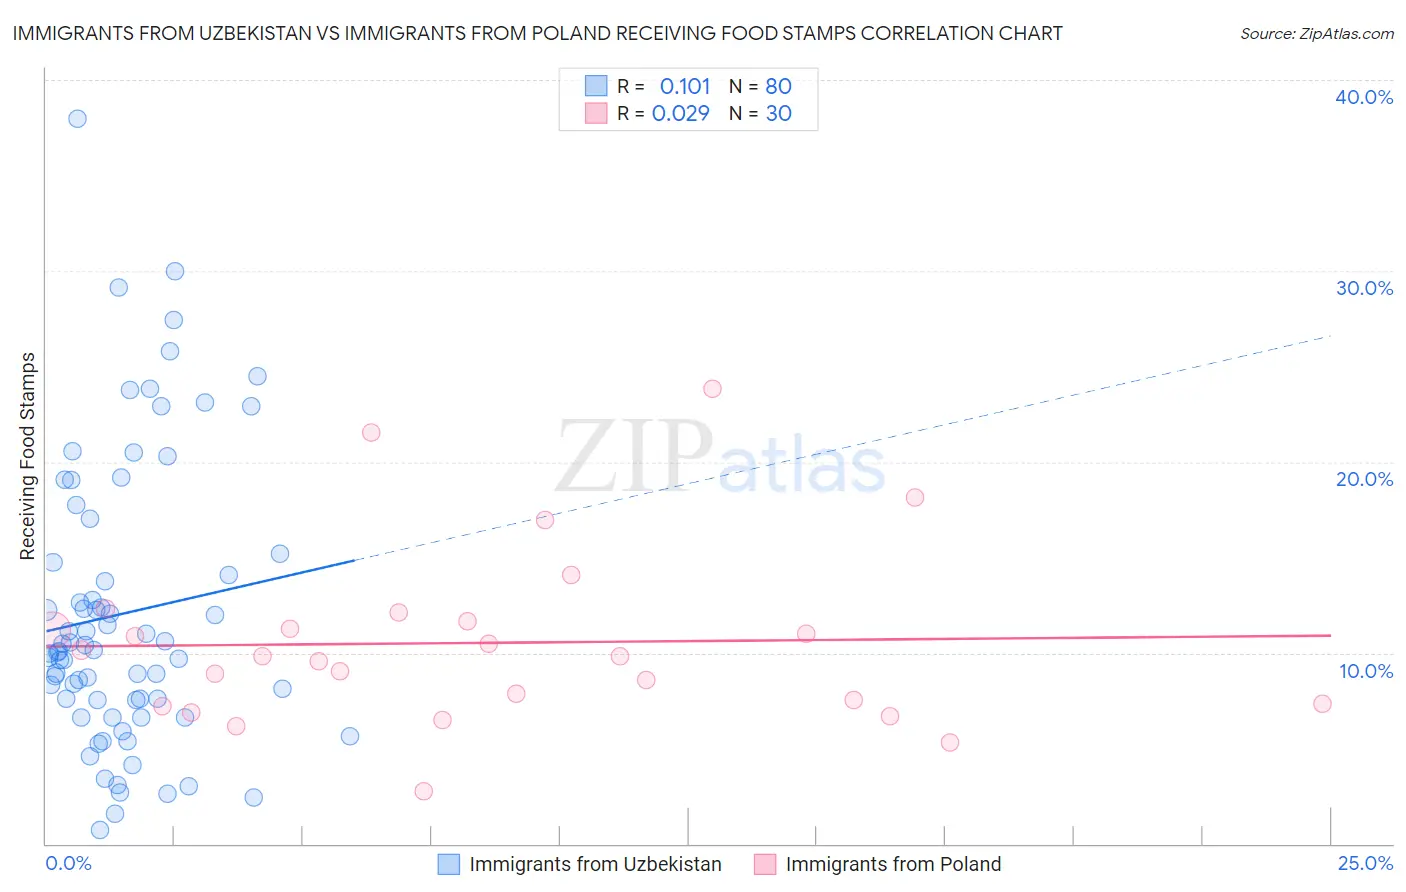
Immigrants from Uzbekistan vs Immigrants from Poland Receiving Food Stamps Correlation Chart
The statistical analysis conducted on geographies consisting of 118,563,262 people shows a poor positive correlation between the proportion of Immigrants from Uzbekistan and percentage of population receiving government assistance and/or food stamps in the United States with a correlation coefficient (R) of 0.101 and weighted average of 14.3%. Similarly, the statistical analysis conducted on geographies consisting of 304,061,523 people shows no correlation between the proportion of Immigrants from Poland and percentage of population receiving government assistance and/or food stamps in the United States with a correlation coefficient (R) of 0.029 and weighted average of 10.6%, a difference of 34.5%.
Receiving Food Stamps Correlation Summary
| Measurement | Immigrants from Uzbekistan | Immigrants from Poland |
| Minimum | 0.70% | 2.8% |
| Maximum | 38.0% | 23.8% |
| Range | 37.3% | 21.0% |
| Mean | 12.1% | 10.5% |
| Median | 10.1% | 9.8% |
| Interquartile 25% (IQ1) | 7.5% | 7.3% |
| Interquartile 75% (IQ3) | 15.0% | 11.6% |
| Interquartile Range (IQR) | 7.4% | 4.3% |
| Standard Deviation (Sample) | 7.5% | 4.6% |
| Standard Deviation (Population) | 7.4% | 4.5% |
Similar Demographics by Receiving Food Stamps
Demographics Similar to Immigrants from Uzbekistan by Receiving Food Stamps
In terms of receiving food stamps, the demographic groups most similar to Immigrants from Uzbekistan are Blackfeet (14.3%, a difference of 0.050%), Immigrants from Portugal (14.3%, a difference of 0.090%), Paiute (14.3%, a difference of 0.10%), Cheyenne (14.3%, a difference of 0.14%), and Dutch West Indian (14.3%, a difference of 0.36%).
| Demographics | Rating | Rank | Receiving Food Stamps |
| Arapaho | 0.3 /100 | #257 | Tragic 14.1% |
| Immigrants | Ghana | 0.3 /100 | #258 | Tragic 14.1% |
| Creek | 0.3 /100 | #259 | Tragic 14.1% |
| Central Americans | 0.3 /100 | #260 | Tragic 14.1% |
| Immigrants | Congo | 0.3 /100 | #261 | Tragic 14.1% |
| Paiute | 0.2 /100 | #262 | Tragic 14.3% |
| Immigrants | Portugal | 0.2 /100 | #263 | Tragic 14.3% |
| Immigrants | Uzbekistan | 0.2 /100 | #264 | Tragic 14.3% |
| Blackfeet | 0.2 /100 | #265 | Tragic 14.3% |
| Cheyenne | 0.2 /100 | #266 | Tragic 14.3% |
| Dutch West Indians | 0.2 /100 | #267 | Tragic 14.3% |
| Guatemalans | 0.1 /100 | #268 | Tragic 14.4% |
| Nepalese | 0.1 /100 | #269 | Tragic 14.6% |
| Mexicans | 0.1 /100 | #270 | Tragic 14.6% |
| Immigrants | Guatemala | 0.1 /100 | #271 | Tragic 14.6% |
Demographics Similar to Immigrants from Poland by Receiving Food Stamps
In terms of receiving food stamps, the demographic groups most similar to Immigrants from Poland are Ethiopian (10.6%, a difference of 0.0%), Slavic (10.6%, a difference of 0.030%), Sri Lankan (10.6%, a difference of 0.11%), Assyrian/Chaldean/Syriac (10.6%, a difference of 0.16%), and Immigrants from Philippines (10.7%, a difference of 0.36%).
| Demographics | Rating | Rank | Receiving Food Stamps |
| Mongolians | 95.8 /100 | #112 | Exceptional 10.5% |
| Icelanders | 95.4 /100 | #113 | Exceptional 10.5% |
| Scotch-Irish | 95.1 /100 | #114 | Exceptional 10.5% |
| Immigrants | Saudi Arabia | 94.9 /100 | #115 | Exceptional 10.5% |
| Canadians | 94.8 /100 | #116 | Exceptional 10.5% |
| Immigrants | Nepal | 94.6 /100 | #117 | Exceptional 10.6% |
| Assyrians/Chaldeans/Syriacs | 94.1 /100 | #118 | Exceptional 10.6% |
| Immigrants | Poland | 93.9 /100 | #119 | Exceptional 10.6% |
| Ethiopians | 93.9 /100 | #120 | Exceptional 10.6% |
| Slavs | 93.8 /100 | #121 | Exceptional 10.6% |
| Sri Lankans | 93.7 /100 | #122 | Exceptional 10.6% |
| Immigrants | Philippines | 93.3 /100 | #123 | Exceptional 10.7% |
| Paraguayans | 93.0 /100 | #124 | Exceptional 10.7% |
| Ukrainians | 92.8 /100 | #125 | Exceptional 10.7% |
| Afghans | 92.6 /100 | #126 | Exceptional 10.7% |