Peruvian vs Immigrants from Fiji No Vehicles in Household
COMPARE
Peruvian
Immigrants from Fiji
No Vehicles in Household
No Vehicles in Household Comparison
Peruvians
Immigrants from Fiji
11.2%
NO VEHICLES IN HOUSEHOLD
8.4/ 100
METRIC RATING
221st/ 347
METRIC RANK
7.8%
NO VEHICLES IN HOUSEHOLD
99.9/ 100
METRIC RATING
39th/ 347
METRIC RANK
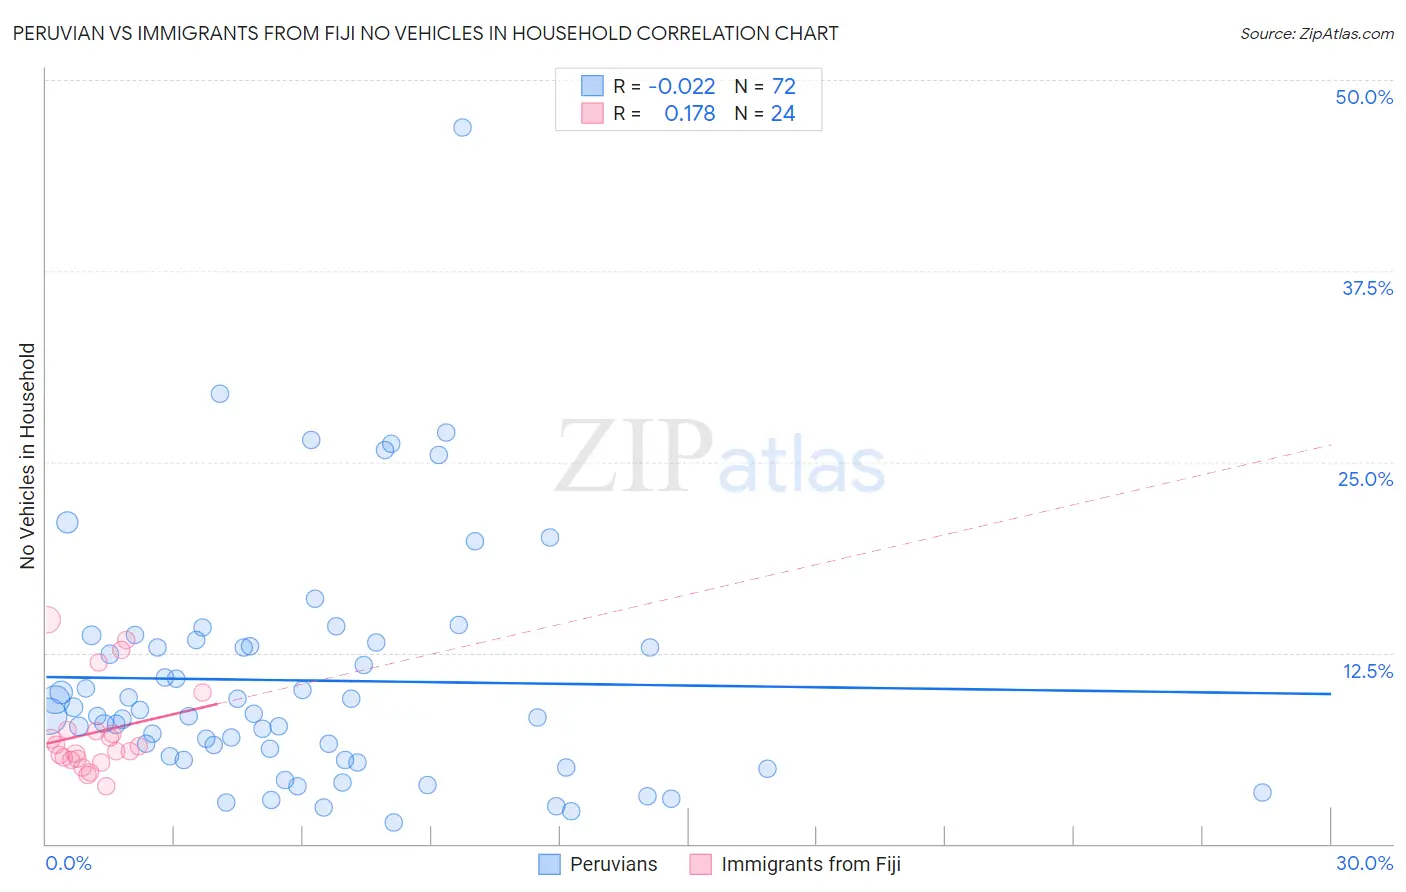
Peruvian vs Immigrants from Fiji No Vehicles in Household Correlation Chart
The statistical analysis conducted on geographies consisting of 362,463,529 people shows no correlation between the proportion of Peruvians and percentage of households with no vehicle available in the United States with a correlation coefficient (R) of -0.022 and weighted average of 11.2%. Similarly, the statistical analysis conducted on geographies consisting of 93,723,528 people shows a poor positive correlation between the proportion of Immigrants from Fiji and percentage of households with no vehicle available in the United States with a correlation coefficient (R) of 0.178 and weighted average of 7.8%, a difference of 43.8%.
No Vehicles in Household Correlation Summary
| Measurement | Peruvian | Immigrants from Fiji |
| Minimum | 1.4% | 3.8% |
| Maximum | 46.9% | 14.7% |
| Range | 45.6% | 10.9% |
| Mean | 10.7% | 7.3% |
| Median | 8.4% | 6.2% |
| Interquartile 25% (IQ1) | 5.6% | 5.5% |
| Interquartile 75% (IQ3) | 13.1% | 7.4% |
| Interquartile Range (IQR) | 7.5% | 1.9% |
| Standard Deviation (Sample) | 7.9% | 3.0% |
| Standard Deviation (Population) | 7.8% | 2.9% |
Similar Demographics by No Vehicles in Household
Demographics Similar to Peruvians by No Vehicles in Household
In terms of no vehicles in household, the demographic groups most similar to Peruvians are Immigrants from South America (11.3%, a difference of 0.15%), Uruguayan (11.3%, a difference of 0.30%), Immigrants from Zaire (11.2%, a difference of 0.45%), Argentinean (11.2%, a difference of 0.47%), and Immigrants from Hong Kong (11.3%, a difference of 0.52%).
| Demographics | Rating | Rank | No Vehicles in Household |
| Immigrants | Denmark | 12.1 /100 | #214 | Poor 11.1% |
| Immigrants | Sri Lanka | 10.6 /100 | #215 | Poor 11.2% |
| Immigrants | Argentina | 10.6 /100 | #216 | Poor 11.2% |
| Dutch West Indians | 10.2 /100 | #217 | Poor 11.2% |
| Immigrants | Guatemala | 10.0 /100 | #218 | Tragic 11.2% |
| Argentineans | 9.6 /100 | #219 | Tragic 11.2% |
| Immigrants | Zaire | 9.6 /100 | #220 | Tragic 11.2% |
| Peruvians | 8.4 /100 | #221 | Tragic 11.2% |
| Immigrants | South America | 8.0 /100 | #222 | Tragic 11.3% |
| Uruguayans | 7.7 /100 | #223 | Tragic 11.3% |
| Immigrants | Hong Kong | 7.2 /100 | #224 | Tragic 11.3% |
| Immigrants | Sierra Leone | 6.4 /100 | #225 | Tragic 11.3% |
| Immigrants | Somalia | 5.4 /100 | #226 | Tragic 11.4% |
| Immigrants | Pakistan | 5.4 /100 | #227 | Tragic 11.4% |
| Immigrants | Romania | 5.3 /100 | #228 | Tragic 11.4% |
Demographics Similar to Immigrants from Fiji by No Vehicles in Household
In terms of no vehicles in household, the demographic groups most similar to Immigrants from Fiji are Czechoslovakian (7.8%, a difference of 0.10%), French Canadian (7.8%, a difference of 0.24%), Swiss (7.9%, a difference of 0.38%), Chickasaw (7.9%, a difference of 0.46%), and Creek (7.8%, a difference of 0.58%).
| Demographics | Rating | Rank | No Vehicles in Household |
| Malaysians | 100.0 /100 | #32 | Exceptional 7.7% |
| Immigrants | Taiwan | 100.0 /100 | #33 | Exceptional 7.7% |
| Immigrants | Vietnam | 100.0 /100 | #34 | Exceptional 7.7% |
| Cherokee | 99.9 /100 | #35 | Exceptional 7.7% |
| Iraqis | 99.9 /100 | #36 | Exceptional 7.7% |
| Basques | 99.9 /100 | #37 | Exceptional 7.8% |
| Creek | 99.9 /100 | #38 | Exceptional 7.8% |
| Immigrants | Fiji | 99.9 /100 | #39 | Exceptional 7.8% |
| Czechoslovakians | 99.9 /100 | #40 | Exceptional 7.8% |
| French Canadians | 99.9 /100 | #41 | Exceptional 7.8% |
| Swiss | 99.9 /100 | #42 | Exceptional 7.9% |
| Chickasaw | 99.9 /100 | #43 | Exceptional 7.9% |
| Choctaw | 99.9 /100 | #44 | Exceptional 7.9% |
| Immigrants | Nonimmigrants | 99.9 /100 | #45 | Exceptional 7.9% |
| Spanish | 99.9 /100 | #46 | Exceptional 7.9% |