European vs Immigrants from Honduras Family Poverty
COMPARE
European
Immigrants from Honduras
Family Poverty
Family Poverty Comparison
Europeans
Immigrants from Honduras
7.7%
FAMILY POVERTY
98.7/ 100
METRIC RATING
59th/ 347
METRIC RANK
12.7%
FAMILY POVERTY
0.0/ 100
METRIC RATING
322nd/ 347
METRIC RANK
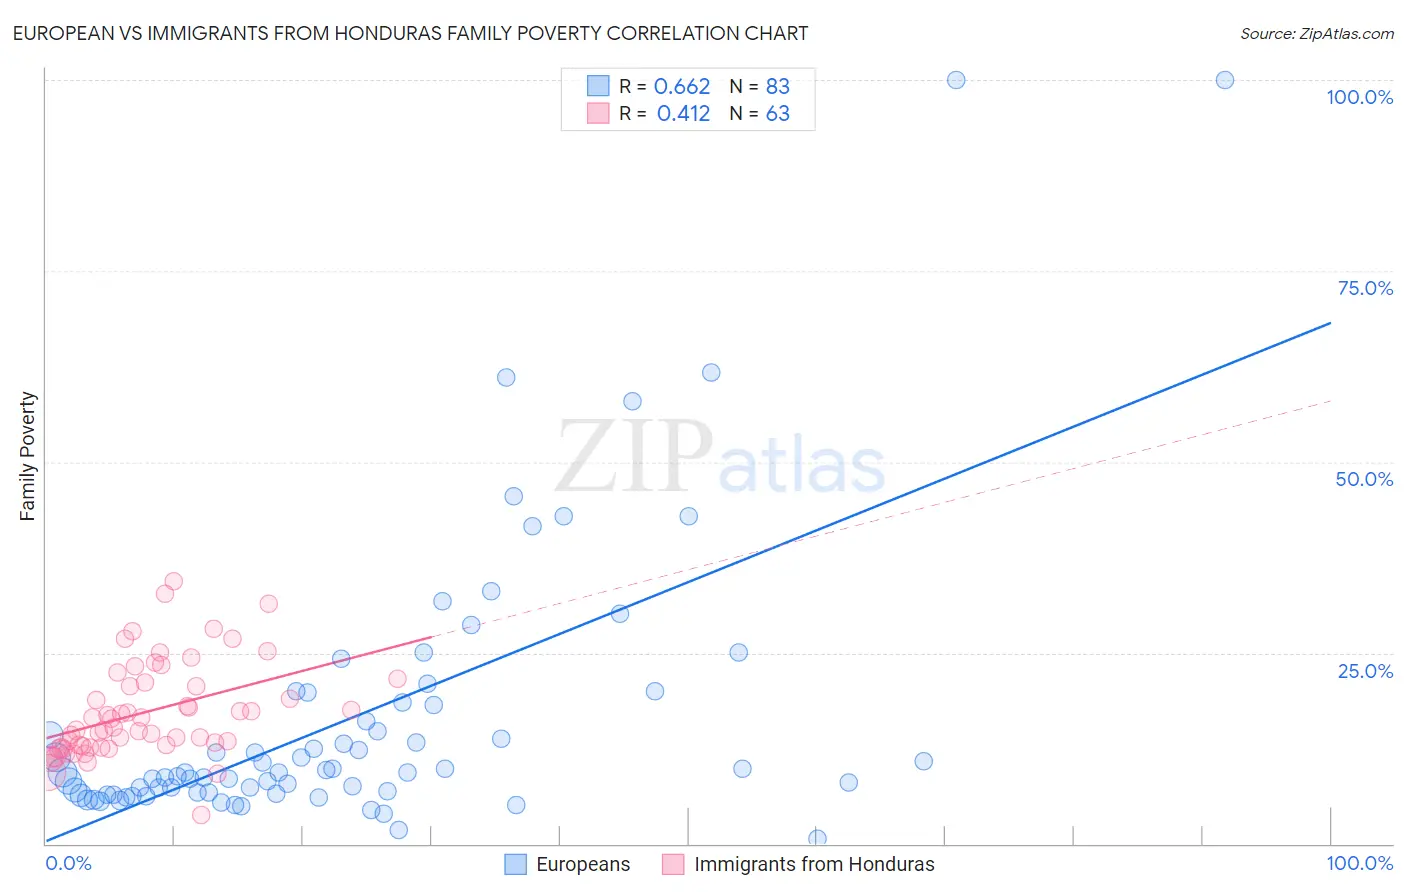
European vs Immigrants from Honduras Family Poverty Correlation Chart
The statistical analysis conducted on geographies consisting of 557,705,193 people shows a significant positive correlation between the proportion of Europeans and poverty level among families in the United States with a correlation coefficient (R) of 0.662 and weighted average of 7.7%. Similarly, the statistical analysis conducted on geographies consisting of 322,221,893 people shows a moderate positive correlation between the proportion of Immigrants from Honduras and poverty level among families in the United States with a correlation coefficient (R) of 0.412 and weighted average of 12.7%, a difference of 63.8%.
Family Poverty Correlation Summary
| Measurement | European | Immigrants from Honduras |
| Minimum | 0.65% | 3.7% |
| Maximum | 100.0% | 34.3% |
| Range | 99.4% | 30.6% |
| Mean | 16.6% | 17.2% |
| Median | 9.3% | 15.3% |
| Interquartile 25% (IQ1) | 6.7% | 12.7% |
| Interquartile 75% (IQ3) | 18.4% | 21.1% |
| Interquartile Range (IQR) | 11.8% | 8.5% |
| Standard Deviation (Sample) | 18.6% | 6.2% |
| Standard Deviation (Population) | 18.5% | 6.2% |
Similar Demographics by Family Poverty
Demographics Similar to Europeans by Family Poverty
In terms of family poverty, the demographic groups most similar to Europeans are Finnish (7.7%, a difference of 0.010%), Immigrants from Greece (7.7%, a difference of 0.010%), Asian (7.7%, a difference of 0.040%), Immigrants from Serbia (7.7%, a difference of 0.13%), and Immigrants from Eastern Asia (7.7%, a difference of 0.17%).
| Demographics | Rating | Rank | Family Poverty |
| Indians (Asian) | 98.8 /100 | #52 | Exceptional 7.7% |
| Swiss | 98.8 /100 | #53 | Exceptional 7.7% |
| Immigrants | Sweden | 98.8 /100 | #54 | Exceptional 7.7% |
| Immigrants | Eastern Asia | 98.7 /100 | #55 | Exceptional 7.7% |
| Immigrants | Serbia | 98.7 /100 | #56 | Exceptional 7.7% |
| Asians | 98.7 /100 | #57 | Exceptional 7.7% |
| Finns | 98.7 /100 | #58 | Exceptional 7.7% |
| Europeans | 98.7 /100 | #59 | Exceptional 7.7% |
| Immigrants | Greece | 98.7 /100 | #60 | Exceptional 7.7% |
| Immigrants | Netherlands | 98.6 /100 | #61 | Exceptional 7.7% |
| Macedonians | 98.6 /100 | #62 | Exceptional 7.8% |
| Zimbabweans | 98.4 /100 | #63 | Exceptional 7.8% |
| Koreans | 98.3 /100 | #64 | Exceptional 7.8% |
| Immigrants | Bulgaria | 98.3 /100 | #65 | Exceptional 7.8% |
| Dutch | 98.3 /100 | #66 | Exceptional 7.8% |
Demographics Similar to Immigrants from Honduras by Family Poverty
In terms of family poverty, the demographic groups most similar to Immigrants from Honduras are Arapaho (12.7%, a difference of 0.10%), Menominee (12.7%, a difference of 0.54%), Immigrants from Dominica (12.7%, a difference of 0.62%), Inupiat (12.5%, a difference of 1.6%), and British West Indian (12.4%, a difference of 2.1%).
| Demographics | Rating | Rank | Family Poverty |
| Immigrants | Mexico | 0.0 /100 | #315 | Tragic 12.3% |
| Hondurans | 0.0 /100 | #316 | Tragic 12.4% |
| Immigrants | Grenada | 0.0 /100 | #317 | Tragic 12.4% |
| U.S. Virgin Islanders | 0.0 /100 | #318 | Tragic 12.4% |
| British West Indians | 0.0 /100 | #319 | Tragic 12.4% |
| Inupiat | 0.0 /100 | #320 | Tragic 12.5% |
| Arapaho | 0.0 /100 | #321 | Tragic 12.7% |
| Immigrants | Honduras | 0.0 /100 | #322 | Tragic 12.7% |
| Menominee | 0.0 /100 | #323 | Tragic 12.7% |
| Immigrants | Dominica | 0.0 /100 | #324 | Tragic 12.7% |
| Paiute | 0.0 /100 | #325 | Tragic 13.0% |
| Colville | 0.0 /100 | #326 | Tragic 13.0% |
| Yakama | 0.0 /100 | #327 | Tragic 13.1% |
| Central American Indians | 0.0 /100 | #328 | Tragic 13.3% |
| Blacks/African Americans | 0.0 /100 | #329 | Tragic 13.3% |