Paraguayan vs Cree Single Mother Poverty
COMPARE
Paraguayan
Cree
Single Mother Poverty
Single Mother Poverty Comparison
Paraguayans
Cree
27.2%
SINGLE MOTHER POVERTY
99.6/ 100
METRIC RATING
59th/ 347
METRIC RANK
32.2%
SINGLE MOTHER POVERTY
0.0/ 100
METRIC RATING
281st/ 347
METRIC RANK
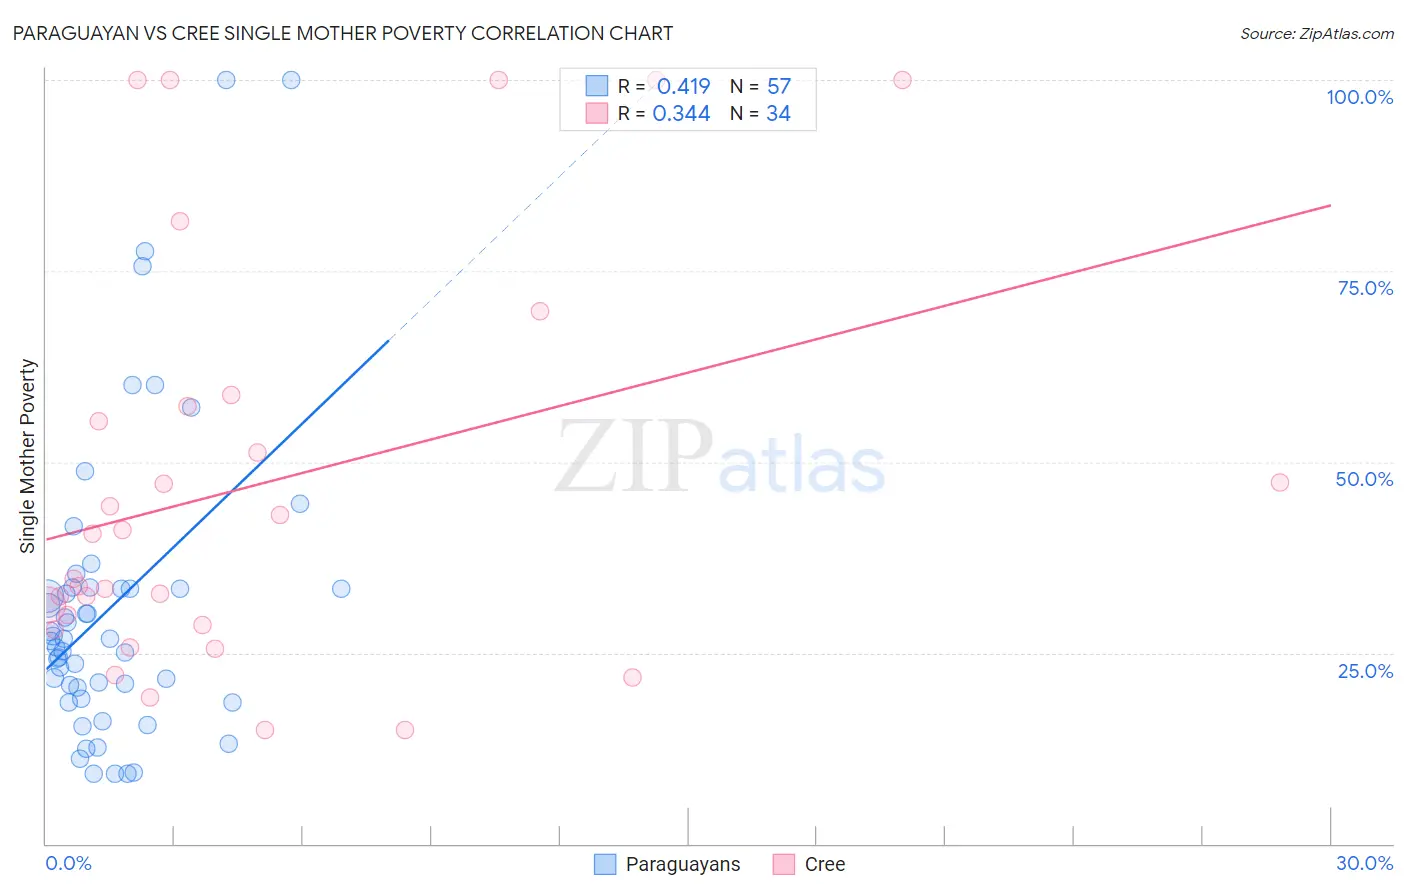
Paraguayan vs Cree Single Mother Poverty Correlation Chart
The statistical analysis conducted on geographies consisting of 94,301,501 people shows a moderate positive correlation between the proportion of Paraguayans and poverty level among single mothers in the United States with a correlation coefficient (R) of 0.419 and weighted average of 27.2%. Similarly, the statistical analysis conducted on geographies consisting of 75,775,779 people shows a mild positive correlation between the proportion of Cree and poverty level among single mothers in the United States with a correlation coefficient (R) of 0.344 and weighted average of 32.2%, a difference of 18.3%.
Single Mother Poverty Correlation Summary
| Measurement | Paraguayan | Cree |
| Minimum | 9.1% | 14.9% |
| Maximum | 100.0% | 100.0% |
| Range | 90.9% | 85.1% |
| Mean | 31.1% | 47.0% |
| Median | 26.8% | 37.6% |
| Interquartile 25% (IQ1) | 19.7% | 28.6% |
| Interquartile 75% (IQ3) | 33.4% | 57.4% |
| Interquartile Range (IQR) | 13.7% | 28.8% |
| Standard Deviation (Sample) | 19.9% | 26.7% |
| Standard Deviation (Population) | 19.7% | 26.3% |
Similar Demographics by Single Mother Poverty
Demographics Similar to Paraguayans by Single Mother Poverty
In terms of single mother poverty, the demographic groups most similar to Paraguayans are Argentinean (27.2%, a difference of 0.010%), Eastern European (27.2%, a difference of 0.040%), Immigrants from Eastern Europe (27.2%, a difference of 0.15%), Palestinian (27.2%, a difference of 0.17%), and Immigrants from Romania (27.2%, a difference of 0.20%).
| Demographics | Rating | Rank | Single Mother Poverty |
| Immigrants | South Eastern Asia | 99.7 /100 | #52 | Exceptional 27.1% |
| Immigrants | Jordan | 99.7 /100 | #53 | Exceptional 27.1% |
| Immigrants | Bulgaria | 99.7 /100 | #54 | Exceptional 27.1% |
| Immigrants | Egypt | 99.7 /100 | #55 | Exceptional 27.1% |
| Immigrants | Romania | 99.7 /100 | #56 | Exceptional 27.2% |
| Palestinians | 99.7 /100 | #57 | Exceptional 27.2% |
| Argentineans | 99.6 /100 | #58 | Exceptional 27.2% |
| Paraguayans | 99.6 /100 | #59 | Exceptional 27.2% |
| Eastern Europeans | 99.6 /100 | #60 | Exceptional 27.2% |
| Immigrants | Eastern Europe | 99.6 /100 | #61 | Exceptional 27.2% |
| Immigrants | Malaysia | 99.5 /100 | #62 | Exceptional 27.3% |
| Immigrants | Northern Europe | 99.5 /100 | #63 | Exceptional 27.3% |
| Russians | 99.5 /100 | #64 | Exceptional 27.3% |
| Immigrants | Turkey | 99.5 /100 | #65 | Exceptional 27.3% |
| Soviet Union | 99.5 /100 | #66 | Exceptional 27.3% |
Demographics Similar to Cree by Single Mother Poverty
In terms of single mother poverty, the demographic groups most similar to Cree are Nonimmigrants (32.2%, a difference of 0.030%), Immigrants from the Azores (32.2%, a difference of 0.11%), Marshallese (32.1%, a difference of 0.24%), Spanish American (32.3%, a difference of 0.36%), and Immigrants from Zaire (32.0%, a difference of 0.64%).
| Demographics | Rating | Rank | Single Mother Poverty |
| Bangladeshis | 0.1 /100 | #274 | Tragic 31.7% |
| Central Americans | 0.1 /100 | #275 | Tragic 31.8% |
| Delaware | 0.0 /100 | #276 | Tragic 31.8% |
| Mexican American Indians | 0.0 /100 | #277 | Tragic 31.9% |
| Immigrants | Zaire | 0.0 /100 | #278 | Tragic 32.0% |
| Marshallese | 0.0 /100 | #279 | Tragic 32.1% |
| Immigrants | Nonimmigrants | 0.0 /100 | #280 | Tragic 32.2% |
| Cree | 0.0 /100 | #281 | Tragic 32.2% |
| Immigrants | Azores | 0.0 /100 | #282 | Tragic 32.2% |
| Spanish Americans | 0.0 /100 | #283 | Tragic 32.3% |
| Indonesians | 0.0 /100 | #284 | Tragic 32.4% |
| Immigrants | Latin America | 0.0 /100 | #285 | Tragic 32.4% |
| Yup'ik | 0.0 /100 | #286 | Tragic 32.5% |
| Immigrants | Dominica | 0.0 /100 | #287 | Tragic 32.5% |
| Somalis | 0.0 /100 | #288 | Tragic 32.6% |