Immigrants from Bahamas vs Tongan Single Father Poverty
COMPARE
Immigrants from Bahamas
Tongan
Single Father Poverty
Single Father Poverty Comparison
Immigrants from Bahamas
Tongans
18.1%
SINGLE FATHER POVERTY
0.0/ 100
METRIC RATING
292nd/ 347
METRIC RANK
12.2%
SINGLE FATHER POVERTY
100.0/ 100
METRIC RATING
2nd/ 347
METRIC RANK
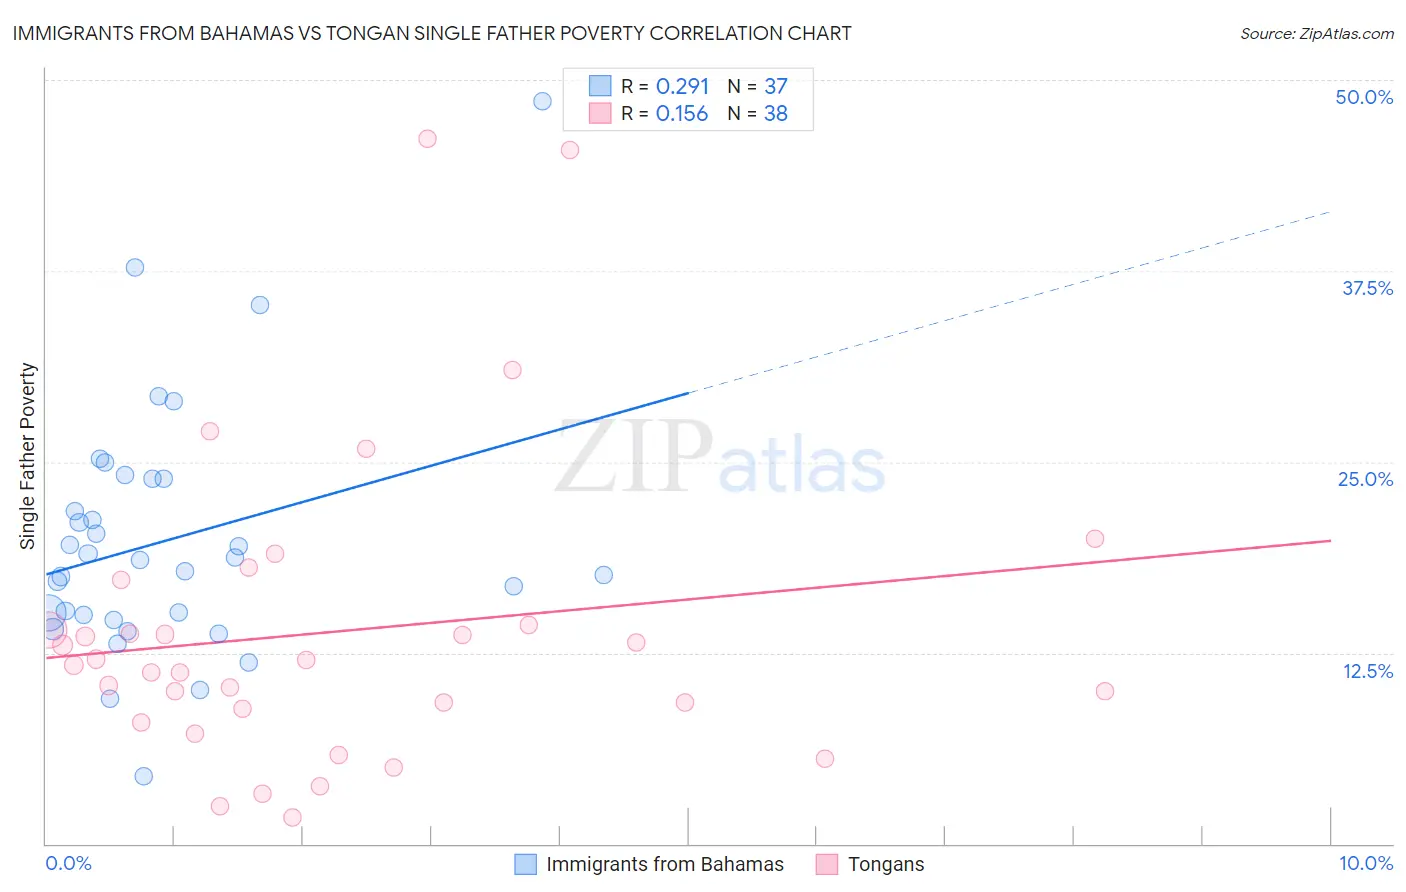
Immigrants from Bahamas vs Tongan Single Father Poverty Correlation Chart
The statistical analysis conducted on geographies consisting of 96,162,173 people shows a weak positive correlation between the proportion of Immigrants from Bahamas and poverty level among single fathers in the United States with a correlation coefficient (R) of 0.291 and weighted average of 18.1%. Similarly, the statistical analysis conducted on geographies consisting of 92,788,841 people shows a poor positive correlation between the proportion of Tongans and poverty level among single fathers in the United States with a correlation coefficient (R) of 0.156 and weighted average of 12.2%, a difference of 48.1%.
Single Father Poverty Correlation Summary
| Measurement | Immigrants from Bahamas | Tongan |
| Minimum | 4.5% | 1.7% |
| Maximum | 48.6% | 46.2% |
| Range | 44.1% | 44.4% |
| Mean | 19.9% | 13.9% |
| Median | 18.6% | 11.8% |
| Interquartile 25% (IQ1) | 14.8% | 8.8% |
| Interquartile 75% (IQ3) | 23.9% | 14.3% |
| Interquartile Range (IQR) | 9.1% | 5.5% |
| Standard Deviation (Sample) | 8.3% | 10.0% |
| Standard Deviation (Population) | 8.2% | 9.8% |
Similar Demographics by Single Father Poverty
Demographics Similar to Immigrants from Bahamas by Single Father Poverty
In terms of single father poverty, the demographic groups most similar to Immigrants from Bahamas are Alaskan Athabascan (18.1%, a difference of 0.010%), Alaska Native (18.1%, a difference of 0.11%), U.S. Virgin Islander (18.1%, a difference of 0.13%), Yakama (18.1%, a difference of 0.20%), and West Indian (18.0%, a difference of 0.23%).
| Demographics | Rating | Rank | Single Father Poverty |
| Immigrants | Lebanon | 0.0 /100 | #285 | Tragic 17.9% |
| Immigrants | North Macedonia | 0.0 /100 | #286 | Tragic 17.9% |
| Carpatho Rusyns | 0.0 /100 | #287 | Tragic 18.0% |
| Bahamians | 0.0 /100 | #288 | Tragic 18.0% |
| Irish | 0.0 /100 | #289 | Tragic 18.0% |
| West Indians | 0.0 /100 | #290 | Tragic 18.0% |
| Alaskan Athabascans | 0.0 /100 | #291 | Tragic 18.1% |
| Immigrants | Bahamas | 0.0 /100 | #292 | Tragic 18.1% |
| Alaska Natives | 0.0 /100 | #293 | Tragic 18.1% |
| U.S. Virgin Islanders | 0.0 /100 | #294 | Tragic 18.1% |
| Yakama | 0.0 /100 | #295 | Tragic 18.1% |
| Seminole | 0.0 /100 | #296 | Tragic 18.1% |
| French | 0.0 /100 | #297 | Tragic 18.2% |
| Africans | 0.0 /100 | #298 | Tragic 18.3% |
| Whites/Caucasians | 0.0 /100 | #299 | Tragic 18.4% |
Demographics Similar to Tongans by Single Father Poverty
In terms of single father poverty, the demographic groups most similar to Tongans are Tsimshian (12.7%, a difference of 3.9%), Assyrian/Chaldean/Syriac (11.7%, a difference of 4.2%), Immigrants from Fiji (13.2%, a difference of 8.3%), Immigrants from Ethiopia (13.4%, a difference of 10.0%), and Ethiopian (13.5%, a difference of 10.9%).
| Demographics | Rating | Rank | Single Father Poverty |
| Assyrians/Chaldeans/Syriacs | 100.0 /100 | #1 | Exceptional 11.7% |
| Tongans | 100.0 /100 | #2 | Exceptional 12.2% |
| Tsimshian | 100.0 /100 | #3 | Exceptional 12.7% |
| Immigrants | Fiji | 100.0 /100 | #4 | Exceptional 13.2% |
| Immigrants | Ethiopia | 100.0 /100 | #5 | Exceptional 13.4% |
| Ethiopians | 100.0 /100 | #6 | Exceptional 13.5% |
| Immigrants | Taiwan | 100.0 /100 | #7 | Exceptional 13.7% |
| Samoans | 100.0 /100 | #8 | Exceptional 13.8% |
| Afghans | 100.0 /100 | #9 | Exceptional 14.0% |
| Koreans | 100.0 /100 | #10 | Exceptional 14.0% |
| Filipinos | 100.0 /100 | #11 | Exceptional 14.0% |
| Immigrants | India | 100.0 /100 | #12 | Exceptional 14.0% |
| Immigrants | Philippines | 100.0 /100 | #13 | Exceptional 14.0% |
| Immigrants | Vietnam | 100.0 /100 | #14 | Exceptional 14.1% |
| Sri Lankans | 100.0 /100 | #15 | Exceptional 14.2% |