Albanian vs Tongan Single Father Poverty
COMPARE
Albanian
Tongan
Single Father Poverty
Single Father Poverty Comparison
Albanians
Tongans
17.2%
SINGLE FATHER POVERTY
0.7/ 100
METRIC RATING
258th/ 347
METRIC RANK
12.2%
SINGLE FATHER POVERTY
100.0/ 100
METRIC RATING
2nd/ 347
METRIC RANK
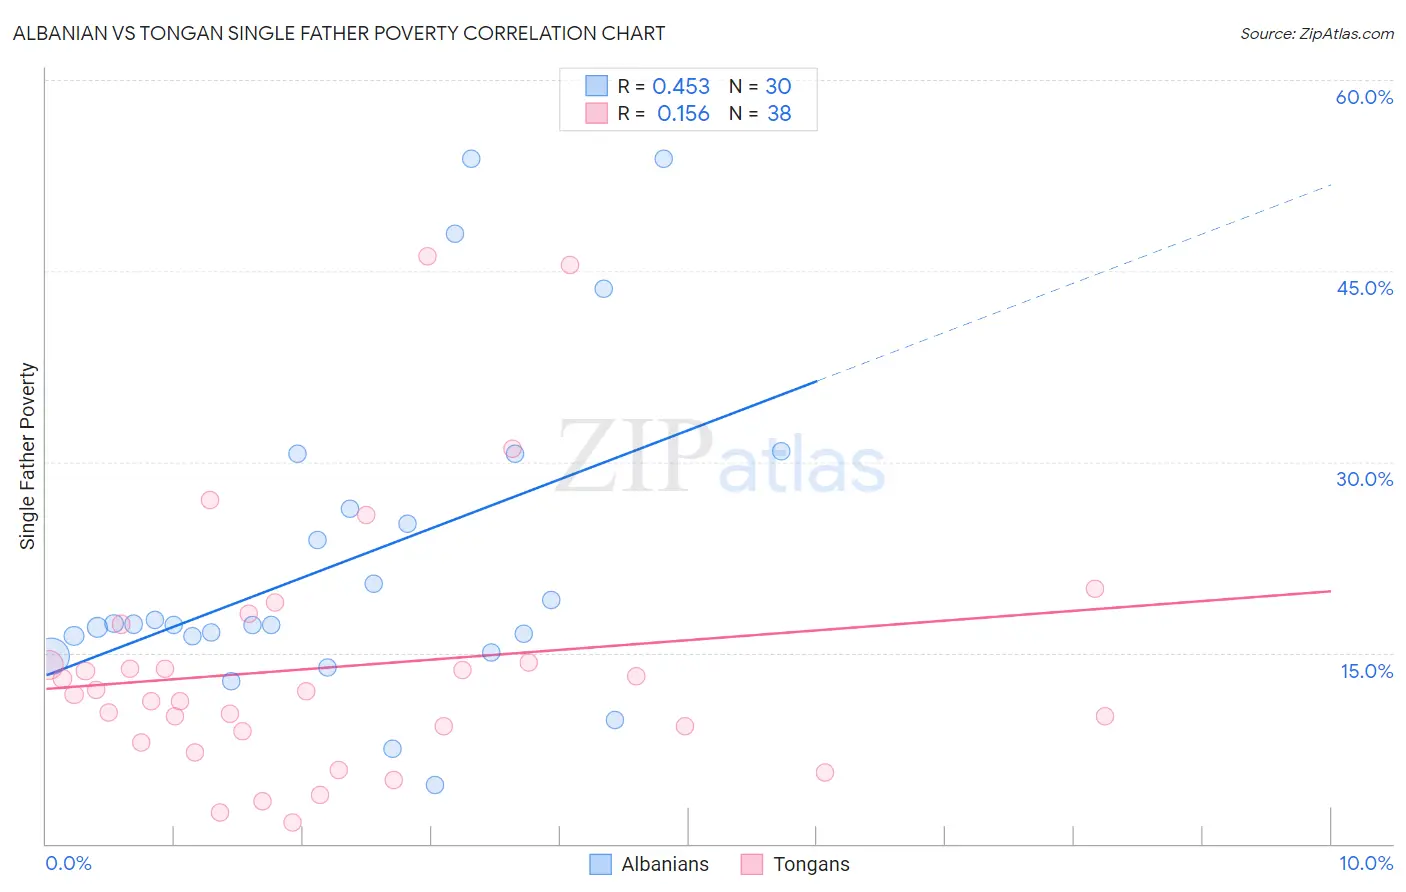
Albanian vs Tongan Single Father Poverty Correlation Chart
The statistical analysis conducted on geographies consisting of 159,395,060 people shows a moderate positive correlation between the proportion of Albanians and poverty level among single fathers in the United States with a correlation coefficient (R) of 0.453 and weighted average of 17.2%. Similarly, the statistical analysis conducted on geographies consisting of 92,788,841 people shows a poor positive correlation between the proportion of Tongans and poverty level among single fathers in the United States with a correlation coefficient (R) of 0.156 and weighted average of 12.2%, a difference of 40.7%.
Single Father Poverty Correlation Summary
| Measurement | Albanian | Tongan |
| Minimum | 4.7% | 1.7% |
| Maximum | 53.8% | 46.2% |
| Range | 49.2% | 44.4% |
| Mean | 22.4% | 13.9% |
| Median | 17.2% | 11.8% |
| Interquartile 25% (IQ1) | 16.3% | 8.8% |
| Interquartile 75% (IQ3) | 26.4% | 14.3% |
| Interquartile Range (IQR) | 10.1% | 5.5% |
| Standard Deviation (Sample) | 12.6% | 10.0% |
| Standard Deviation (Population) | 12.4% | 9.8% |
Similar Demographics by Single Father Poverty
Demographics Similar to Albanians by Single Father Poverty
In terms of single father poverty, the demographic groups most similar to Albanians are Immigrants from Albania (17.2%, a difference of 0.020%), Immigrants from Jamaica (17.2%, a difference of 0.040%), Immigrants from Haiti (17.2%, a difference of 0.10%), Sierra Leonean (17.2%, a difference of 0.11%), and Spaniard (17.2%, a difference of 0.18%).
| Demographics | Rating | Rank | Single Father Poverty |
| Luxembourgers | 1.1 /100 | #251 | Tragic 17.1% |
| Croatians | 1.0 /100 | #252 | Tragic 17.1% |
| Cree | 1.0 /100 | #253 | Tragic 17.1% |
| Immigrants | Honduras | 0.9 /100 | #254 | Tragic 17.1% |
| Sierra Leoneans | 0.8 /100 | #255 | Tragic 17.2% |
| Immigrants | Haiti | 0.8 /100 | #256 | Tragic 17.2% |
| Immigrants | Albania | 0.7 /100 | #257 | Tragic 17.2% |
| Albanians | 0.7 /100 | #258 | Tragic 17.2% |
| Immigrants | Jamaica | 0.7 /100 | #259 | Tragic 17.2% |
| Spaniards | 0.6 /100 | #260 | Tragic 17.2% |
| Swiss | 0.5 /100 | #261 | Tragic 17.3% |
| Immigrants | Zaire | 0.4 /100 | #262 | Tragic 17.3% |
| Lithuanians | 0.4 /100 | #263 | Tragic 17.3% |
| Slovenes | 0.3 /100 | #264 | Tragic 17.3% |
| Poles | 0.3 /100 | #265 | Tragic 17.3% |
Demographics Similar to Tongans by Single Father Poverty
In terms of single father poverty, the demographic groups most similar to Tongans are Tsimshian (12.7%, a difference of 3.9%), Assyrian/Chaldean/Syriac (11.7%, a difference of 4.2%), Immigrants from Fiji (13.2%, a difference of 8.3%), Immigrants from Ethiopia (13.4%, a difference of 10.0%), and Ethiopian (13.5%, a difference of 10.9%).
| Demographics | Rating | Rank | Single Father Poverty |
| Assyrians/Chaldeans/Syriacs | 100.0 /100 | #1 | Exceptional 11.7% |
| Tongans | 100.0 /100 | #2 | Exceptional 12.2% |
| Tsimshian | 100.0 /100 | #3 | Exceptional 12.7% |
| Immigrants | Fiji | 100.0 /100 | #4 | Exceptional 13.2% |
| Immigrants | Ethiopia | 100.0 /100 | #5 | Exceptional 13.4% |
| Ethiopians | 100.0 /100 | #6 | Exceptional 13.5% |
| Immigrants | Taiwan | 100.0 /100 | #7 | Exceptional 13.7% |
| Samoans | 100.0 /100 | #8 | Exceptional 13.8% |
| Afghans | 100.0 /100 | #9 | Exceptional 14.0% |
| Koreans | 100.0 /100 | #10 | Exceptional 14.0% |
| Filipinos | 100.0 /100 | #11 | Exceptional 14.0% |
| Immigrants | India | 100.0 /100 | #12 | Exceptional 14.0% |
| Immigrants | Philippines | 100.0 /100 | #13 | Exceptional 14.0% |
| Immigrants | Vietnam | 100.0 /100 | #14 | Exceptional 14.1% |
| Sri Lankans | 100.0 /100 | #15 | Exceptional 14.2% |