Panamanian vs Cherokee Single Mother Poverty
COMPARE
Panamanian
Cherokee
Single Mother Poverty
Single Mother Poverty Comparison
Panamanians
Cherokee
29.6%
SINGLE MOTHER POVERTY
20.0/ 100
METRIC RATING
200th/ 347
METRIC RANK
34.5%
SINGLE MOTHER POVERTY
0.0/ 100
METRIC RATING
317th/ 347
METRIC RANK
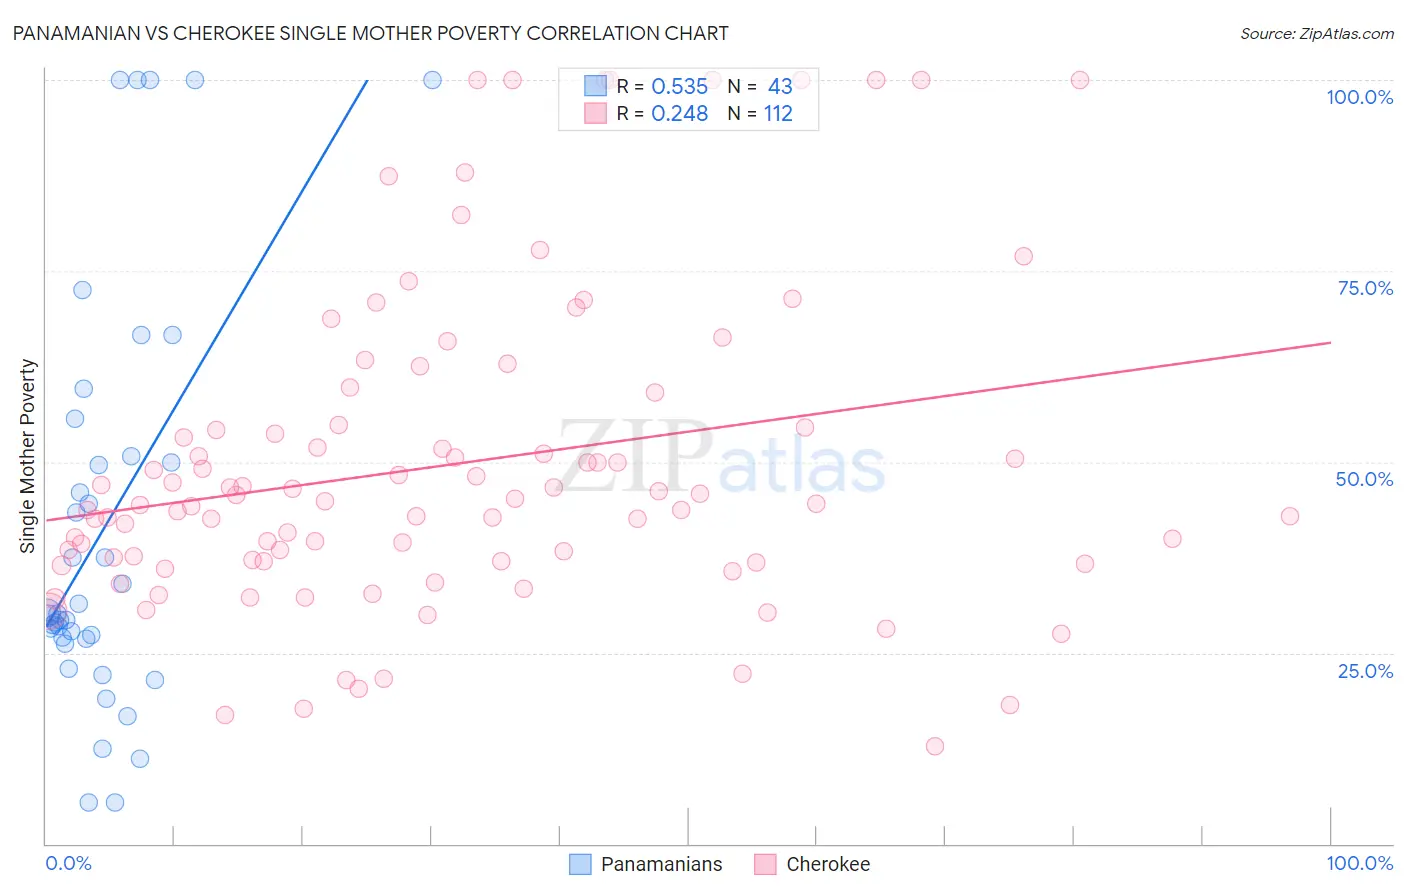
Panamanian vs Cherokee Single Mother Poverty Correlation Chart
The statistical analysis conducted on geographies consisting of 277,785,222 people shows a substantial positive correlation between the proportion of Panamanians and poverty level among single mothers in the United States with a correlation coefficient (R) of 0.535 and weighted average of 29.6%. Similarly, the statistical analysis conducted on geographies consisting of 479,873,905 people shows a weak positive correlation between the proportion of Cherokee and poverty level among single mothers in the United States with a correlation coefficient (R) of 0.248 and weighted average of 34.5%, a difference of 16.5%.
Single Mother Poverty Correlation Summary
| Measurement | Panamanian | Cherokee |
| Minimum | 5.3% | 12.7% |
| Maximum | 100.0% | 100.0% |
| Range | 94.7% | 87.3% |
| Mean | 41.4% | 49.7% |
| Median | 30.1% | 44.6% |
| Interquartile 25% (IQ1) | 26.9% | 37.0% |
| Interquartile 75% (IQ3) | 50.7% | 54.7% |
| Interquartile Range (IQR) | 23.8% | 17.6% |
| Standard Deviation (Sample) | 26.4% | 20.8% |
| Standard Deviation (Population) | 26.1% | 20.7% |
Similar Demographics by Single Mother Poverty
Demographics Similar to Panamanians by Single Mother Poverty
In terms of single mother poverty, the demographic groups most similar to Panamanians are Cuban (29.6%, a difference of 0.050%), Belgian (29.7%, a difference of 0.10%), Trinidadian and Tobagonian (29.6%, a difference of 0.12%), Immigrants from Jamaica (29.6%, a difference of 0.14%), and Malaysian (29.7%, a difference of 0.20%).
| Demographics | Rating | Rank | Single Mother Poverty |
| Basques | 28.3 /100 | #193 | Fair 29.5% |
| Icelanders | 26.1 /100 | #194 | Fair 29.5% |
| Slavs | 24.5 /100 | #195 | Fair 29.6% |
| Spanish American Indians | 23.4 /100 | #196 | Fair 29.6% |
| Immigrants | Jamaica | 22.0 /100 | #197 | Fair 29.6% |
| Trinidadians and Tobagonians | 21.7 /100 | #198 | Fair 29.6% |
| Cubans | 20.8 /100 | #199 | Fair 29.6% |
| Panamanians | 20.0 /100 | #200 | Fair 29.6% |
| Belgians | 18.8 /100 | #201 | Poor 29.7% |
| Malaysians | 17.4 /100 | #202 | Poor 29.7% |
| Swiss | 17.2 /100 | #203 | Poor 29.7% |
| Immigrants | Immigrants | 16.6 /100 | #204 | Poor 29.7% |
| Czechoslovakians | 16.1 /100 | #205 | Poor 29.7% |
| Immigrants | Haiti | 15.8 /100 | #206 | Poor 29.7% |
| Immigrants | Panama | 15.5 /100 | #207 | Poor 29.8% |
Demographics Similar to Cherokee by Single Mother Poverty
In terms of single mother poverty, the demographic groups most similar to Cherokee are Dominican (34.5%, a difference of 0.11%), Hopi (34.5%, a difference of 0.22%), Chickasaw (34.4%, a difference of 0.30%), Immigrants from Dominican Republic (34.4%, a difference of 0.48%), and Immigrants from Honduras (34.7%, a difference of 0.52%).
| Demographics | Rating | Rank | Single Mother Poverty |
| Hondurans | 0.0 /100 | #310 | Tragic 34.2% |
| Alsatians | 0.0 /100 | #311 | Tragic 34.3% |
| Central American Indians | 0.0 /100 | #312 | Tragic 34.3% |
| Immigrants | Dominican Republic | 0.0 /100 | #313 | Tragic 34.4% |
| Chickasaw | 0.0 /100 | #314 | Tragic 34.4% |
| Hopi | 0.0 /100 | #315 | Tragic 34.5% |
| Dominicans | 0.0 /100 | #316 | Tragic 34.5% |
| Cherokee | 0.0 /100 | #317 | Tragic 34.5% |
| Immigrants | Honduras | 0.0 /100 | #318 | Tragic 34.7% |
| Chippewa | 0.0 /100 | #319 | Tragic 34.8% |
| Iroquois | 0.0 /100 | #320 | Tragic 34.8% |
| Paiute | 0.0 /100 | #321 | Tragic 35.1% |
| Blacks/African Americans | 0.0 /100 | #322 | Tragic 35.2% |
| Kiowa | 0.0 /100 | #323 | Tragic 35.5% |
| Ottawa | 0.0 /100 | #324 | Tragic 35.5% |