Panamanian vs Cherokee 1 or more Vehicles in Household
COMPARE
Panamanian
Cherokee
1 or more Vehicles in Household
1 or more Vehicles in Household Comparison
Panamanians
Cherokee
87.5%
1 OR MORE VEHICLES IN HOUSEHOLD
0.2/ 100
METRIC RATING
270th/ 347
METRIC RANK
92.4%
1 OR MORE VEHICLES IN HOUSEHOLD
100.0/ 100
METRIC RATING
33rd/ 347
METRIC RANK
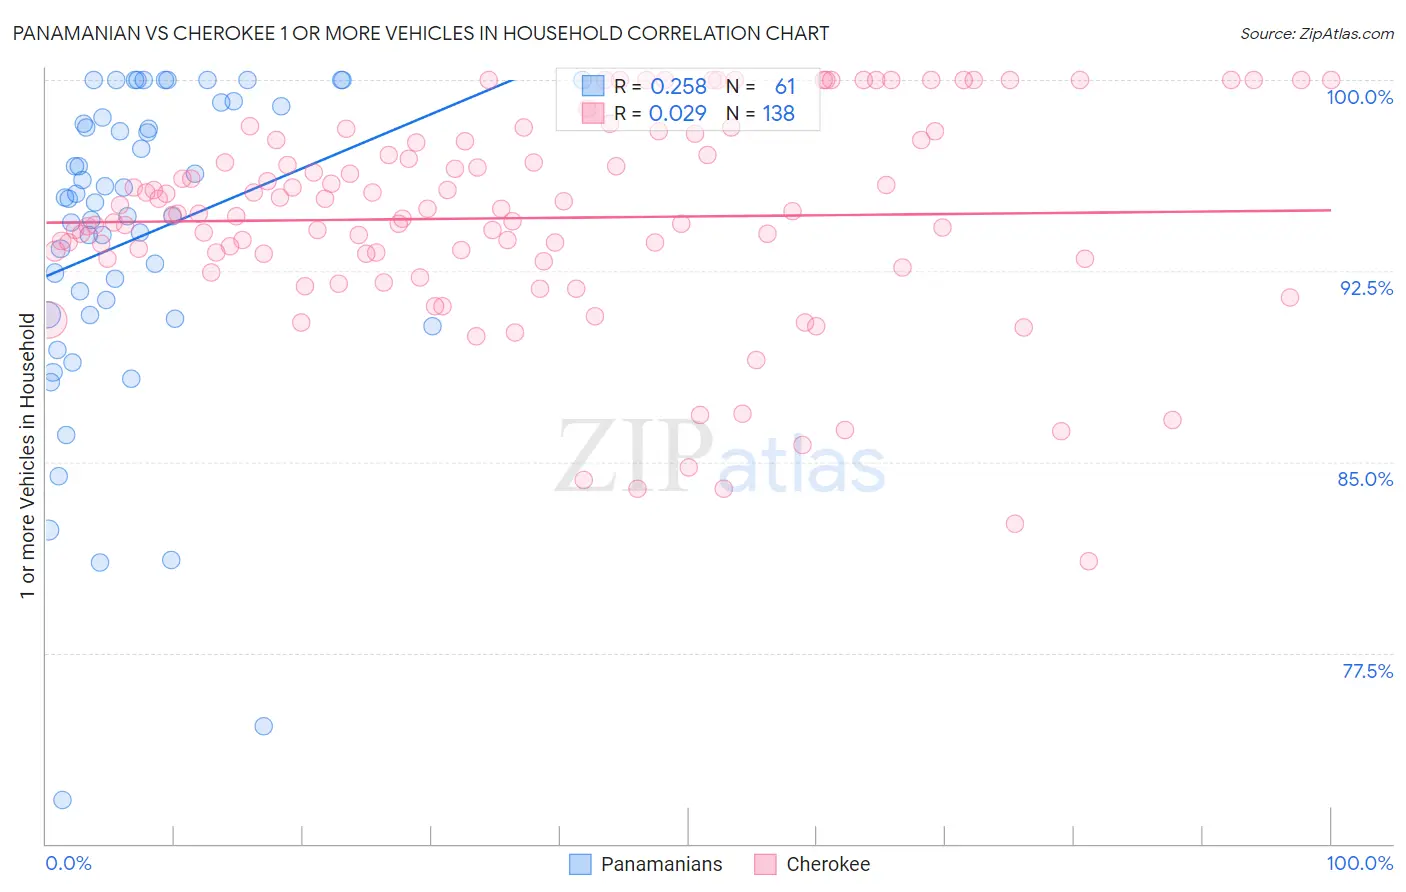
Panamanian vs Cherokee 1 or more Vehicles in Household Correlation Chart
The statistical analysis conducted on geographies consisting of 281,086,843 people shows a weak positive correlation between the proportion of Panamanians and percentage of households with 1 or more vehicles available in the United States with a correlation coefficient (R) of 0.258 and weighted average of 87.5%. Similarly, the statistical analysis conducted on geographies consisting of 493,431,899 people shows no correlation between the proportion of Cherokee and percentage of households with 1 or more vehicles available in the United States with a correlation coefficient (R) of 0.029 and weighted average of 92.4%, a difference of 5.5%.
1 or more Vehicles in Household Correlation Summary
| Measurement | Panamanian | Cherokee |
| Minimum | 71.7% | 81.1% |
| Maximum | 100.0% | 100.0% |
| Range | 28.3% | 18.9% |
| Mean | 93.8% | 94.6% |
| Median | 95.3% | 94.7% |
| Interquartile 25% (IQ1) | 90.8% | 93.0% |
| Interquartile 75% (IQ3) | 98.7% | 97.6% |
| Interquartile Range (IQR) | 8.0% | 4.6% |
| Standard Deviation (Sample) | 6.3% | 4.1% |
| Standard Deviation (Population) | 6.2% | 4.1% |
Similar Demographics by 1 or more Vehicles in Household
Demographics Similar to Panamanians by 1 or more Vehicles in Household
In terms of 1 or more vehicles in household, the demographic groups most similar to Panamanians are Immigrants from Africa (87.6%, a difference of 0.010%), Bermudan (87.5%, a difference of 0.010%), Immigrants from Europe (87.6%, a difference of 0.060%), Aleut (87.5%, a difference of 0.070%), and Immigrants from Colombia (87.6%, a difference of 0.10%).
| Demographics | Rating | Rank | 1 or more Vehicles in Household |
| Immigrants | Egypt | 0.5 /100 | #263 | Tragic 87.8% |
| Immigrants | Liberia | 0.4 /100 | #264 | Tragic 87.8% |
| Africans | 0.4 /100 | #265 | Tragic 87.8% |
| Israelis | 0.3 /100 | #266 | Tragic 87.7% |
| Immigrants | Colombia | 0.3 /100 | #267 | Tragic 87.6% |
| Immigrants | Europe | 0.2 /100 | #268 | Tragic 87.6% |
| Immigrants | Africa | 0.2 /100 | #269 | Tragic 87.6% |
| Panamanians | 0.2 /100 | #270 | Tragic 87.5% |
| Bermudans | 0.2 /100 | #271 | Tragic 87.5% |
| Aleuts | 0.2 /100 | #272 | Tragic 87.5% |
| Immigrants | Northern Africa | 0.2 /100 | #273 | Tragic 87.4% |
| Immigrants | Morocco | 0.1 /100 | #274 | Tragic 87.4% |
| Immigrants | Singapore | 0.1 /100 | #275 | Tragic 87.2% |
| Immigrants | France | 0.1 /100 | #276 | Tragic 87.1% |
| Alsatians | 0.1 /100 | #277 | Tragic 87.1% |
Demographics Similar to Cherokee by 1 or more Vehicles in Household
In terms of 1 or more vehicles in household, the demographic groups most similar to Cherokee are Basque (92.4%, a difference of 0.010%), Samoan (92.4%, a difference of 0.050%), Native Hawaiian (92.4%, a difference of 0.060%), Finnish (92.4%, a difference of 0.060%), and Sri Lankan (92.5%, a difference of 0.070%).
| Demographics | Rating | Rank | 1 or more Vehicles in Household |
| British | 100.0 /100 | #26 | Exceptional 92.5% |
| Americans | 100.0 /100 | #27 | Exceptional 92.5% |
| Sri Lankans | 100.0 /100 | #28 | Exceptional 92.5% |
| Native Hawaiians | 100.0 /100 | #29 | Exceptional 92.4% |
| Finns | 100.0 /100 | #30 | Exceptional 92.4% |
| Samoans | 100.0 /100 | #31 | Exceptional 92.4% |
| Basques | 100.0 /100 | #32 | Exceptional 92.4% |
| Cherokee | 100.0 /100 | #33 | Exceptional 92.4% |
| Italians | 99.9 /100 | #34 | Exceptional 92.3% |
| Czechoslovakians | 99.9 /100 | #35 | Exceptional 92.3% |
| Malaysians | 99.9 /100 | #36 | Exceptional 92.3% |
| French Canadians | 99.9 /100 | #37 | Exceptional 92.3% |
| Immigrants | Vietnam | 99.9 /100 | #38 | Exceptional 92.3% |
| Swiss | 99.9 /100 | #39 | Exceptional 92.3% |
| Creek | 99.9 /100 | #40 | Exceptional 92.3% |