Cheyenne vs Cherokee Single Mother Poverty
COMPARE
Cheyenne
Cherokee
Single Mother Poverty
Single Mother Poverty Comparison
Cheyenne
Cherokee
38.5%
SINGLE MOTHER POVERTY
0.0/ 100
METRIC RATING
336th/ 347
METRIC RANK
34.5%
SINGLE MOTHER POVERTY
0.0/ 100
METRIC RATING
317th/ 347
METRIC RANK
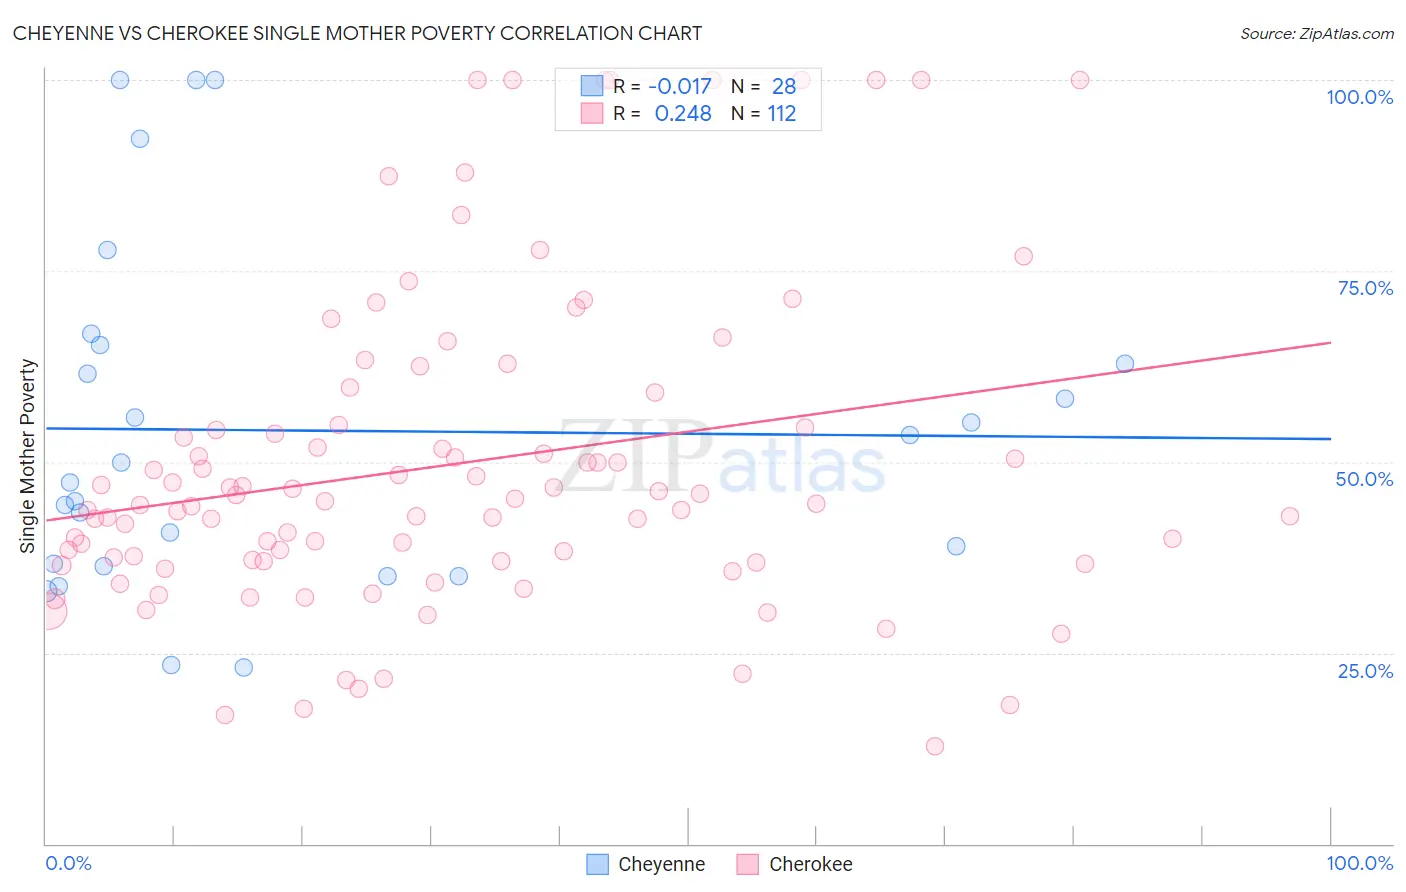
Cheyenne vs Cherokee Single Mother Poverty Correlation Chart
The statistical analysis conducted on geographies consisting of 80,348,704 people shows no correlation between the proportion of Cheyenne and poverty level among single mothers in the United States with a correlation coefficient (R) of -0.017 and weighted average of 38.5%. Similarly, the statistical analysis conducted on geographies consisting of 479,873,905 people shows a weak positive correlation between the proportion of Cherokee and poverty level among single mothers in the United States with a correlation coefficient (R) of 0.248 and weighted average of 34.5%, a difference of 11.5%.
Single Mother Poverty Correlation Summary
| Measurement | Cheyenne | Cherokee |
| Minimum | 23.1% | 12.7% |
| Maximum | 100.0% | 100.0% |
| Range | 76.9% | 87.3% |
| Mean | 54.1% | 49.7% |
| Median | 48.6% | 44.6% |
| Interquartile 25% (IQ1) | 36.5% | 37.0% |
| Interquartile 75% (IQ3) | 64.1% | 54.7% |
| Interquartile Range (IQR) | 27.6% | 17.6% |
| Standard Deviation (Sample) | 22.5% | 20.8% |
| Standard Deviation (Population) | 22.1% | 20.7% |
Demographics Similar to Cheyenne and Cherokee by Single Mother Poverty
In terms of single mother poverty, the demographic groups most similar to Cheyenne are Yuman (37.8%, a difference of 1.9%), Pueblo (37.2%, a difference of 3.5%), Menominee (37.1%, a difference of 3.9%), Dutch West Indian (36.8%, a difference of 4.7%), and Creek (36.7%, a difference of 4.9%). Similarly, the demographic groups most similar to Cherokee are Dominican (34.5%, a difference of 0.11%), Immigrants from Honduras (34.7%, a difference of 0.52%), Chippewa (34.8%, a difference of 0.67%), Iroquois (34.8%, a difference of 0.91%), and Paiute (35.1%, a difference of 1.8%).
| Demographics | Rating | Rank | Single Mother Poverty |
| Dominicans | 0.0 /100 | #316 | Tragic 34.5% |
| Cherokee | 0.0 /100 | #317 | Tragic 34.5% |
| Immigrants | Honduras | 0.0 /100 | #318 | Tragic 34.7% |
| Chippewa | 0.0 /100 | #319 | Tragic 34.8% |
| Iroquois | 0.0 /100 | #320 | Tragic 34.8% |
| Paiute | 0.0 /100 | #321 | Tragic 35.1% |
| Blacks/African Americans | 0.0 /100 | #322 | Tragic 35.2% |
| Kiowa | 0.0 /100 | #323 | Tragic 35.5% |
| Ottawa | 0.0 /100 | #324 | Tragic 35.5% |
| Ute | 0.0 /100 | #325 | Tragic 35.7% |
| Seminole | 0.0 /100 | #326 | Tragic 35.8% |
| Yakama | 0.0 /100 | #327 | Tragic 36.4% |
| Choctaw | 0.0 /100 | #328 | Tragic 36.4% |
| Apache | 0.0 /100 | #329 | Tragic 36.6% |
| Natives/Alaskans | 0.0 /100 | #330 | Tragic 36.6% |
| Creek | 0.0 /100 | #331 | Tragic 36.7% |
| Dutch West Indians | 0.0 /100 | #332 | Tragic 36.8% |
| Menominee | 0.0 /100 | #333 | Tragic 37.1% |
| Pueblo | 0.0 /100 | #334 | Tragic 37.2% |
| Yuman | 0.0 /100 | #335 | Tragic 37.8% |
| Cheyenne | 0.0 /100 | #336 | Tragic 38.5% |