Panamanian vs Immigrants from Western Africa Single Mother Poverty
COMPARE
Panamanian
Immigrants from Western Africa
Single Mother Poverty
Single Mother Poverty Comparison
Panamanians
Immigrants from Western Africa
29.6%
SINGLE MOTHER POVERTY
20.0/ 100
METRIC RATING
200th/ 347
METRIC RANK
29.9%
SINGLE MOTHER POVERTY
11.5/ 100
METRIC RATING
216th/ 347
METRIC RANK
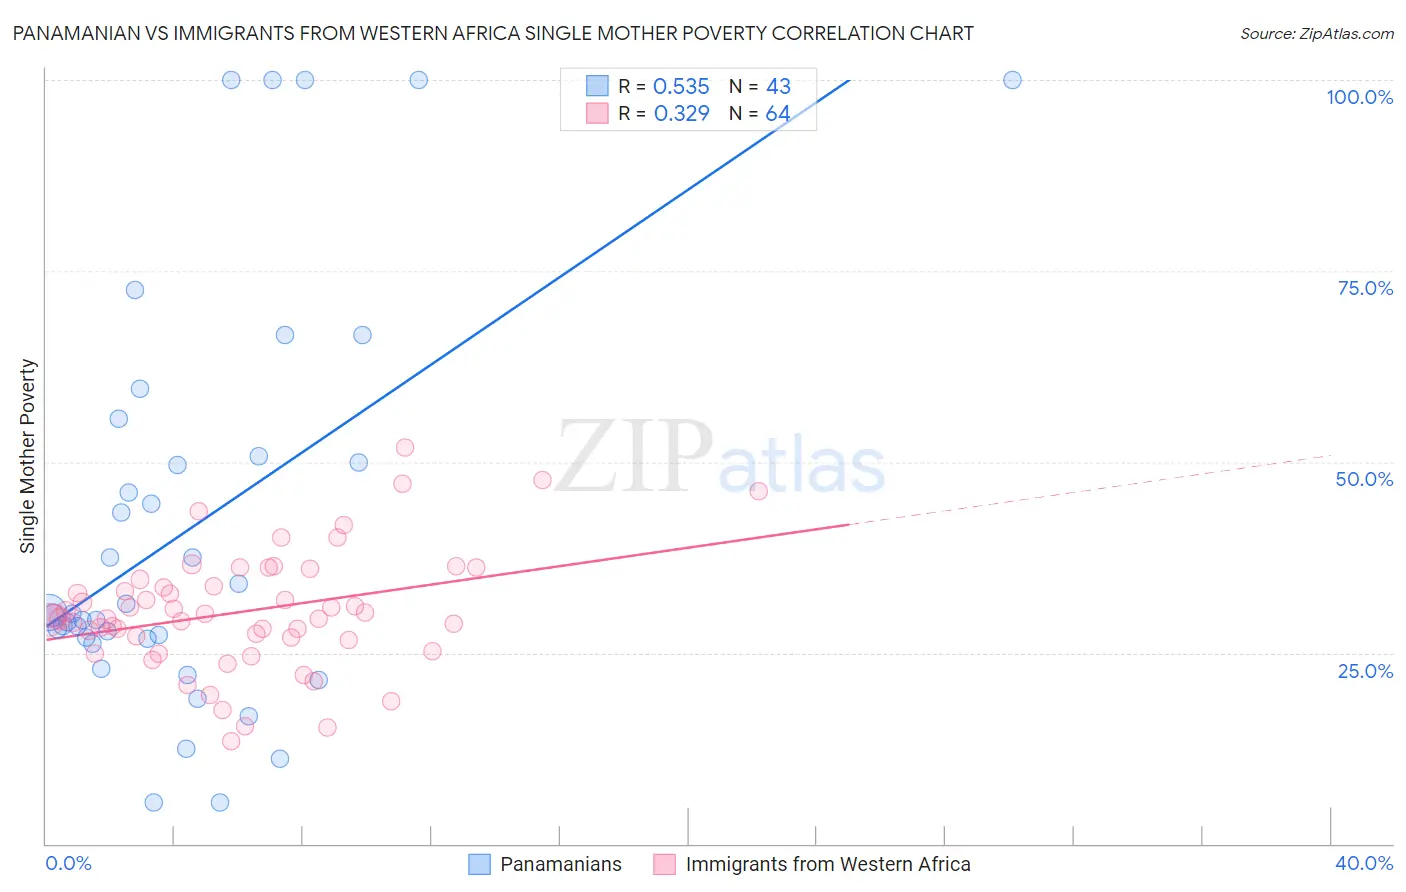
Panamanian vs Immigrants from Western Africa Single Mother Poverty Correlation Chart
The statistical analysis conducted on geographies consisting of 277,785,222 people shows a substantial positive correlation between the proportion of Panamanians and poverty level among single mothers in the United States with a correlation coefficient (R) of 0.535 and weighted average of 29.6%. Similarly, the statistical analysis conducted on geographies consisting of 351,716,965 people shows a mild positive correlation between the proportion of Immigrants from Western Africa and poverty level among single mothers in the United States with a correlation coefficient (R) of 0.329 and weighted average of 29.9%, a difference of 0.77%.
Single Mother Poverty Correlation Summary
| Measurement | Panamanian | Immigrants from Western Africa |
| Minimum | 5.3% | 13.4% |
| Maximum | 100.0% | 51.8% |
| Range | 94.7% | 38.4% |
| Mean | 41.4% | 30.4% |
| Median | 30.1% | 29.6% |
| Interquartile 25% (IQ1) | 26.9% | 26.8% |
| Interquartile 75% (IQ3) | 50.7% | 34.1% |
| Interquartile Range (IQR) | 23.8% | 7.3% |
| Standard Deviation (Sample) | 26.4% | 7.7% |
| Standard Deviation (Population) | 26.1% | 7.7% |
Demographics Similar to Panamanians and Immigrants from Western Africa by Single Mother Poverty
In terms of single mother poverty, the demographic groups most similar to Panamanians are Cuban (29.6%, a difference of 0.050%), Belgian (29.7%, a difference of 0.10%), Trinidadian and Tobagonian (29.6%, a difference of 0.12%), Malaysian (29.7%, a difference of 0.20%), and Swiss (29.7%, a difference of 0.22%). Similarly, the demographic groups most similar to Immigrants from Western Africa are Liberian (29.9%, a difference of 0.020%), Jamaican (29.9%, a difference of 0.020%), Immigrants from Ghana (29.9%, a difference of 0.030%), Immigrants from Thailand (29.9%, a difference of 0.050%), and Nicaraguan (29.8%, a difference of 0.10%).
| Demographics | Rating | Rank | Single Mother Poverty |
| Trinidadians and Tobagonians | 21.7 /100 | #198 | Fair 29.6% |
| Cubans | 20.8 /100 | #199 | Fair 29.6% |
| Panamanians | 20.0 /100 | #200 | Fair 29.6% |
| Belgians | 18.8 /100 | #201 | Poor 29.7% |
| Malaysians | 17.4 /100 | #202 | Poor 29.7% |
| Swiss | 17.2 /100 | #203 | Poor 29.7% |
| Immigrants | Immigrants | 16.6 /100 | #204 | Poor 29.7% |
| Czechoslovakians | 16.1 /100 | #205 | Poor 29.7% |
| Immigrants | Haiti | 15.8 /100 | #206 | Poor 29.7% |
| Immigrants | Panama | 15.5 /100 | #207 | Poor 29.8% |
| Immigrants | Guyana | 14.7 /100 | #208 | Poor 29.8% |
| Irish | 13.9 /100 | #209 | Poor 29.8% |
| Haitians | 13.3 /100 | #210 | Poor 29.8% |
| Guyanese | 12.8 /100 | #211 | Poor 29.8% |
| Nicaraguans | 12.4 /100 | #212 | Poor 29.8% |
| Immigrants | Thailand | 12.0 /100 | #213 | Poor 29.9% |
| Liberians | 11.7 /100 | #214 | Poor 29.9% |
| Jamaicans | 11.7 /100 | #215 | Poor 29.9% |
| Immigrants | Western Africa | 11.5 /100 | #216 | Poor 29.9% |
| Immigrants | Ghana | 11.3 /100 | #217 | Poor 29.9% |
| Hungarians | 10.3 /100 | #218 | Poor 29.9% |