Panamanian vs Cherokee Median Male Earnings
COMPARE
Panamanian
Cherokee
Median Male Earnings
Median Male Earnings Comparison
Panamanians
Cherokee
$52,835
MEDIAN MALE EARNINGS
16.5/ 100
METRIC RATING
203rd/ 347
METRIC RANK
$48,669
MEDIAN MALE EARNINGS
0.3/ 100
METRIC RATING
271st/ 347
METRIC RANK
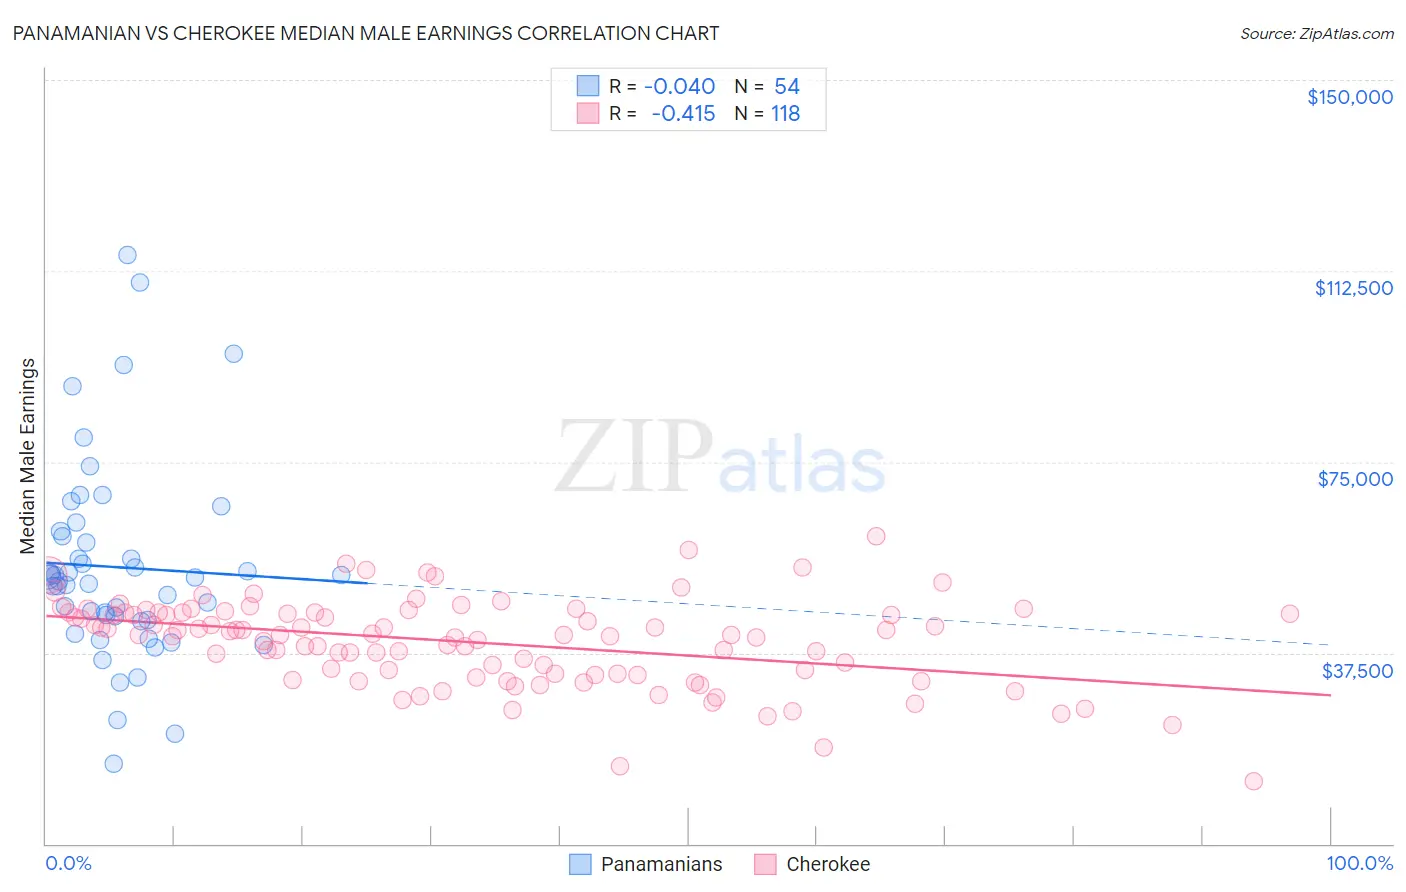
Panamanian vs Cherokee Median Male Earnings Correlation Chart
The statistical analysis conducted on geographies consisting of 281,209,556 people shows no correlation between the proportion of Panamanians and median male earnings in the United States with a correlation coefficient (R) of -0.040 and weighted average of $52,835. Similarly, the statistical analysis conducted on geographies consisting of 493,193,856 people shows a moderate negative correlation between the proportion of Cherokee and median male earnings in the United States with a correlation coefficient (R) of -0.415 and weighted average of $48,669, a difference of 8.6%.
Median Male Earnings Correlation Summary
| Measurement | Panamanian | Cherokee |
| Minimum | $15,735 | $12,361 |
| Maximum | $115,625 | $60,438 |
| Range | $99,890 | $48,077 |
| Mean | $54,298 | $39,586 |
| Median | $51,973 | $40,957 |
| Interquartile 25% (IQ1) | $43,917 | $33,308 |
| Interquartile 75% (IQ3) | $60,350 | $45,365 |
| Interquartile Range (IQR) | $16,433 | $12,057 |
| Standard Deviation (Sample) | $19,573 | $8,544 |
| Standard Deviation (Population) | $19,391 | $8,508 |
Similar Demographics by Median Male Earnings
Demographics Similar to Panamanians by Median Male Earnings
In terms of median male earnings, the demographic groups most similar to Panamanians are Immigrants from Uruguay ($52,860, a difference of 0.050%), Ghanaian ($52,810, a difference of 0.050%), Immigrants from Bosnia and Herzegovina ($52,869, a difference of 0.060%), Immigrants from Thailand ($52,908, a difference of 0.14%), and Immigrants from Colombia ($52,725, a difference of 0.21%).
| Demographics | Rating | Rank | Median Male Earnings |
| Immigrants | Africa | 26.6 /100 | #196 | Fair $53,457 |
| Immigrants | Kenya | 26.0 /100 | #197 | Fair $53,427 |
| Immigrants | Costa Rica | 22.6 /100 | #198 | Fair $53,237 |
| Tongans | 22.3 /100 | #199 | Fair $53,218 |
| Immigrants | Thailand | 17.5 /100 | #200 | Poor $52,908 |
| Immigrants | Bosnia and Herzegovina | 16.9 /100 | #201 | Poor $52,869 |
| Immigrants | Uruguay | 16.8 /100 | #202 | Poor $52,860 |
| Panamanians | 16.5 /100 | #203 | Poor $52,835 |
| Ghanaians | 16.1 /100 | #204 | Poor $52,810 |
| Immigrants | Colombia | 15.0 /100 | #205 | Poor $52,725 |
| Immigrants | Iraq | 14.5 /100 | #206 | Poor $52,681 |
| Vietnamese | 12.7 /100 | #207 | Poor $52,525 |
| Venezuelans | 12.5 /100 | #208 | Poor $52,510 |
| Bermudans | 12.1 /100 | #209 | Poor $52,465 |
| Delaware | 11.5 /100 | #210 | Poor $52,412 |
Demographics Similar to Cherokee by Median Male Earnings
In terms of median male earnings, the demographic groups most similar to Cherokee are Salvadoran ($48,646, a difference of 0.050%), Jamaican ($48,632, a difference of 0.080%), Potawatomi ($48,768, a difference of 0.20%), Colville ($48,516, a difference of 0.32%), and Tsimshian ($48,836, a difference of 0.34%).
| Demographics | Rating | Rank | Median Male Earnings |
| Immigrants | Middle Africa | 0.6 /100 | #264 | Tragic $49,201 |
| Immigrants | Laos | 0.6 /100 | #265 | Tragic $49,190 |
| Somalis | 0.5 /100 | #266 | Tragic $49,025 |
| Spanish Americans | 0.5 /100 | #267 | Tragic $49,008 |
| Ute | 0.4 /100 | #268 | Tragic $48,899 |
| Tsimshian | 0.4 /100 | #269 | Tragic $48,836 |
| Potawatomi | 0.4 /100 | #270 | Tragic $48,768 |
| Cherokee | 0.3 /100 | #271 | Tragic $48,669 |
| Salvadorans | 0.3 /100 | #272 | Tragic $48,646 |
| Jamaicans | 0.3 /100 | #273 | Tragic $48,632 |
| Colville | 0.3 /100 | #274 | Tragic $48,516 |
| Immigrants | Somalia | 0.3 /100 | #275 | Tragic $48,439 |
| Blackfeet | 0.3 /100 | #276 | Tragic $48,402 |
| Belizeans | 0.2 /100 | #277 | Tragic $48,358 |
| Immigrants | Liberia | 0.2 /100 | #278 | Tragic $48,317 |