Immigrants from West Indies vs Cherokee Single Mother Poverty
COMPARE
Immigrants from West Indies
Cherokee
Single Mother Poverty
Single Mother Poverty Comparison
Immigrants from West Indies
Cherokee
31.1%
SINGLE MOTHER POVERTY
0.4/ 100
METRIC RATING
256th/ 347
METRIC RANK
34.5%
SINGLE MOTHER POVERTY
0.0/ 100
METRIC RATING
317th/ 347
METRIC RANK
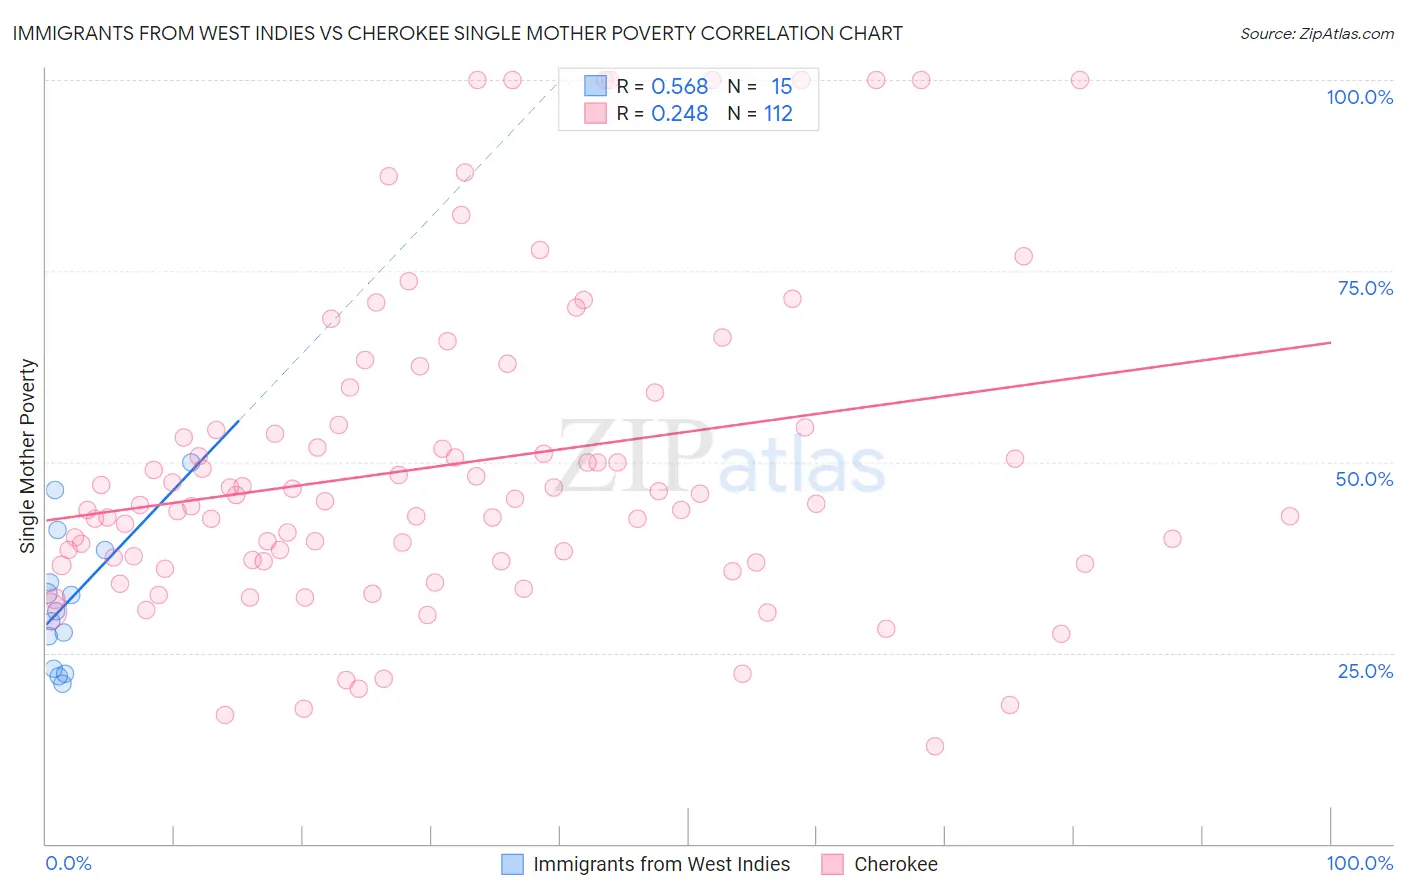
Immigrants from West Indies vs Cherokee Single Mother Poverty Correlation Chart
The statistical analysis conducted on geographies consisting of 72,200,538 people shows a substantial positive correlation between the proportion of Immigrants from West Indies and poverty level among single mothers in the United States with a correlation coefficient (R) of 0.568 and weighted average of 31.1%. Similarly, the statistical analysis conducted on geographies consisting of 479,873,905 people shows a weak positive correlation between the proportion of Cherokee and poverty level among single mothers in the United States with a correlation coefficient (R) of 0.248 and weighted average of 34.5%, a difference of 11.1%.
Single Mother Poverty Correlation Summary
| Measurement | Immigrants from West Indies | Cherokee |
| Minimum | 21.0% | 12.7% |
| Maximum | 50.0% | 100.0% |
| Range | 29.0% | 87.3% |
| Mean | 31.9% | 49.7% |
| Median | 30.5% | 44.6% |
| Interquartile 25% (IQ1) | 22.9% | 37.0% |
| Interquartile 75% (IQ3) | 38.5% | 54.7% |
| Interquartile Range (IQR) | 15.5% | 17.6% |
| Standard Deviation (Sample) | 8.9% | 20.8% |
| Standard Deviation (Population) | 8.6% | 20.7% |
Similar Demographics by Single Mother Poverty
Demographics Similar to Immigrants from West Indies by Single Mother Poverty
In terms of single mother poverty, the demographic groups most similar to Immigrants from West Indies are Immigrants from Bahamas (31.1%, a difference of 0.040%), Immigrants from Caribbean (31.1%, a difference of 0.13%), Immigrants from Bangladesh (31.1%, a difference of 0.16%), Belizean (31.0%, a difference of 0.21%), and Senegalese (31.0%, a difference of 0.32%).
| Demographics | Rating | Rank | Single Mother Poverty |
| Cape Verdeans | 0.8 /100 | #249 | Tragic 30.8% |
| Vietnamese | 0.7 /100 | #250 | Tragic 30.9% |
| Tlingit-Haida | 0.6 /100 | #251 | Tragic 30.9% |
| Alaska Natives | 0.6 /100 | #252 | Tragic 30.9% |
| Celtics | 0.6 /100 | #253 | Tragic 30.9% |
| Senegalese | 0.5 /100 | #254 | Tragic 31.0% |
| Belizeans | 0.5 /100 | #255 | Tragic 31.0% |
| Immigrants | West Indies | 0.4 /100 | #256 | Tragic 31.1% |
| Immigrants | Bahamas | 0.4 /100 | #257 | Tragic 31.1% |
| Immigrants | Caribbean | 0.4 /100 | #258 | Tragic 31.1% |
| Immigrants | Bangladesh | 0.4 /100 | #259 | Tragic 31.1% |
| Whites/Caucasians | 0.3 /100 | #260 | Tragic 31.2% |
| Immigrants | El Salvador | 0.3 /100 | #261 | Tragic 31.2% |
| Hmong | 0.3 /100 | #262 | Tragic 31.2% |
| Bahamians | 0.2 /100 | #263 | Tragic 31.3% |
Demographics Similar to Cherokee by Single Mother Poverty
In terms of single mother poverty, the demographic groups most similar to Cherokee are Dominican (34.5%, a difference of 0.11%), Hopi (34.5%, a difference of 0.22%), Chickasaw (34.4%, a difference of 0.30%), Immigrants from Dominican Republic (34.4%, a difference of 0.48%), and Immigrants from Honduras (34.7%, a difference of 0.52%).
| Demographics | Rating | Rank | Single Mother Poverty |
| Hondurans | 0.0 /100 | #310 | Tragic 34.2% |
| Alsatians | 0.0 /100 | #311 | Tragic 34.3% |
| Central American Indians | 0.0 /100 | #312 | Tragic 34.3% |
| Immigrants | Dominican Republic | 0.0 /100 | #313 | Tragic 34.4% |
| Chickasaw | 0.0 /100 | #314 | Tragic 34.4% |
| Hopi | 0.0 /100 | #315 | Tragic 34.5% |
| Dominicans | 0.0 /100 | #316 | Tragic 34.5% |
| Cherokee | 0.0 /100 | #317 | Tragic 34.5% |
| Immigrants | Honduras | 0.0 /100 | #318 | Tragic 34.7% |
| Chippewa | 0.0 /100 | #319 | Tragic 34.8% |
| Iroquois | 0.0 /100 | #320 | Tragic 34.8% |
| Paiute | 0.0 /100 | #321 | Tragic 35.1% |
| Blacks/African Americans | 0.0 /100 | #322 | Tragic 35.2% |
| Kiowa | 0.0 /100 | #323 | Tragic 35.5% |
| Ottawa | 0.0 /100 | #324 | Tragic 35.5% |