Panamanian vs Bhutanese Single Mother Poverty
COMPARE
Panamanian
Bhutanese
Single Mother Poverty
Single Mother Poverty Comparison
Panamanians
Bhutanese
29.6%
SINGLE MOTHER POVERTY
20.0/ 100
METRIC RATING
200th/ 347
METRIC RANK
25.6%
SINGLE MOTHER POVERTY
100.0/ 100
METRIC RATING
12th/ 347
METRIC RANK
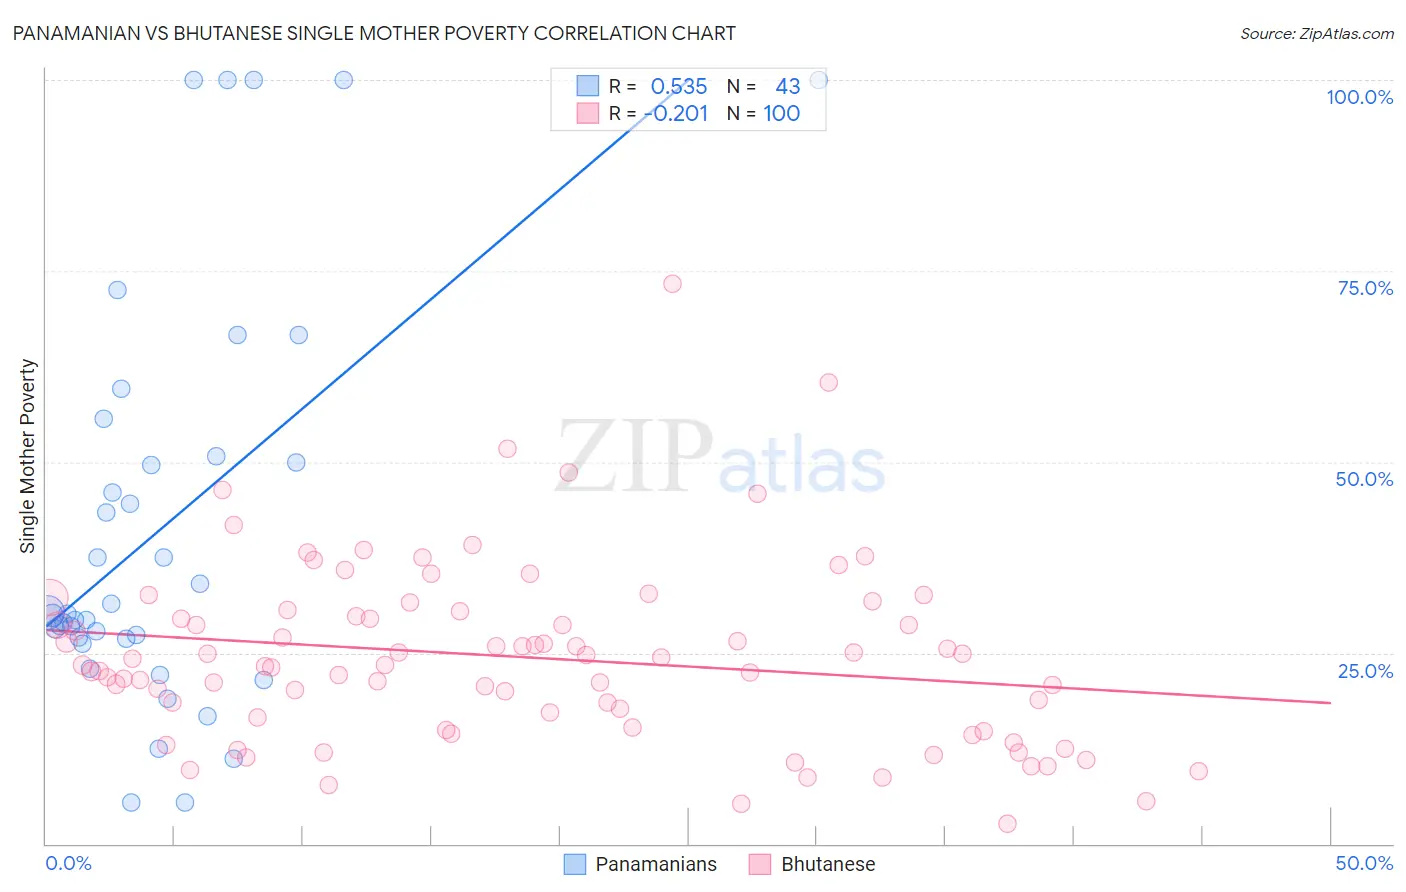
Panamanian vs Bhutanese Single Mother Poverty Correlation Chart
The statistical analysis conducted on geographies consisting of 277,785,222 people shows a substantial positive correlation between the proportion of Panamanians and poverty level among single mothers in the United States with a correlation coefficient (R) of 0.535 and weighted average of 29.6%. Similarly, the statistical analysis conducted on geographies consisting of 442,258,638 people shows a weak negative correlation between the proportion of Bhutanese and poverty level among single mothers in the United States with a correlation coefficient (R) of -0.201 and weighted average of 25.6%, a difference of 15.7%.
Single Mother Poverty Correlation Summary
| Measurement | Panamanian | Bhutanese |
| Minimum | 5.3% | 2.6% |
| Maximum | 100.0% | 73.4% |
| Range | 94.7% | 70.8% |
| Mean | 41.4% | 24.4% |
| Median | 30.1% | 23.4% |
| Interquartile 25% (IQ1) | 26.9% | 15.9% |
| Interquartile 75% (IQ3) | 50.7% | 30.2% |
| Interquartile Range (IQR) | 23.8% | 14.3% |
| Standard Deviation (Sample) | 26.4% | 11.8% |
| Standard Deviation (Population) | 26.1% | 11.8% |
Similar Demographics by Single Mother Poverty
Demographics Similar to Panamanians by Single Mother Poverty
In terms of single mother poverty, the demographic groups most similar to Panamanians are Cuban (29.6%, a difference of 0.050%), Belgian (29.7%, a difference of 0.10%), Trinidadian and Tobagonian (29.6%, a difference of 0.12%), Immigrants from Jamaica (29.6%, a difference of 0.14%), and Malaysian (29.7%, a difference of 0.20%).
| Demographics | Rating | Rank | Single Mother Poverty |
| Basques | 28.3 /100 | #193 | Fair 29.5% |
| Icelanders | 26.1 /100 | #194 | Fair 29.5% |
| Slavs | 24.5 /100 | #195 | Fair 29.6% |
| Spanish American Indians | 23.4 /100 | #196 | Fair 29.6% |
| Immigrants | Jamaica | 22.0 /100 | #197 | Fair 29.6% |
| Trinidadians and Tobagonians | 21.7 /100 | #198 | Fair 29.6% |
| Cubans | 20.8 /100 | #199 | Fair 29.6% |
| Panamanians | 20.0 /100 | #200 | Fair 29.6% |
| Belgians | 18.8 /100 | #201 | Poor 29.7% |
| Malaysians | 17.4 /100 | #202 | Poor 29.7% |
| Swiss | 17.2 /100 | #203 | Poor 29.7% |
| Immigrants | Immigrants | 16.6 /100 | #204 | Poor 29.7% |
| Czechoslovakians | 16.1 /100 | #205 | Poor 29.7% |
| Immigrants | Haiti | 15.8 /100 | #206 | Poor 29.7% |
| Immigrants | Panama | 15.5 /100 | #207 | Poor 29.8% |
Demographics Similar to Bhutanese by Single Mother Poverty
In terms of single mother poverty, the demographic groups most similar to Bhutanese are Iranian (25.5%, a difference of 0.37%), Indian (Asian) (25.8%, a difference of 0.52%), Immigrants from Singapore (25.8%, a difference of 0.67%), Immigrants from Ireland (25.8%, a difference of 0.86%), and Bolivian (25.9%, a difference of 1.1%).
| Demographics | Rating | Rank | Single Mother Poverty |
| Immigrants | Hong Kong | 100.0 /100 | #5 | Exceptional 24.4% |
| Thais | 100.0 /100 | #6 | Exceptional 24.5% |
| Chinese | 100.0 /100 | #7 | Exceptional 24.6% |
| Immigrants | Iran | 100.0 /100 | #8 | Exceptional 25.1% |
| Immigrants | Lithuania | 100.0 /100 | #9 | Exceptional 25.2% |
| Immigrants | South Central Asia | 100.0 /100 | #10 | Exceptional 25.3% |
| Iranians | 100.0 /100 | #11 | Exceptional 25.5% |
| Bhutanese | 100.0 /100 | #12 | Exceptional 25.6% |
| Indians (Asian) | 100.0 /100 | #13 | Exceptional 25.8% |
| Immigrants | Singapore | 100.0 /100 | #14 | Exceptional 25.8% |
| Immigrants | Ireland | 100.0 /100 | #15 | Exceptional 25.8% |
| Bolivians | 100.0 /100 | #16 | Exceptional 25.9% |
| Asians | 100.0 /100 | #17 | Exceptional 26.0% |
| Immigrants | Pakistan | 100.0 /100 | #18 | Exceptional 26.0% |
| Immigrants | Eastern Asia | 100.0 /100 | #19 | Exceptional 26.1% |