Samoan vs U.S. Virgin Islander Seniors Poverty Over the Age of 65
COMPARE
Samoan
U.S. Virgin Islander
Seniors Poverty Over the Age of 65
Seniors Poverty Over the Age of 65 Comparison
Samoans
U.S. Virgin Islanders
10.0%
SENIORS POVERTY OVER THE AGE OF 65
98.0/ 100
METRIC RATING
70th/ 347
METRIC RANK
14.0%
SENIORS POVERTY OVER THE AGE OF 65
0.0/ 100
METRIC RATING
301st/ 347
METRIC RANK
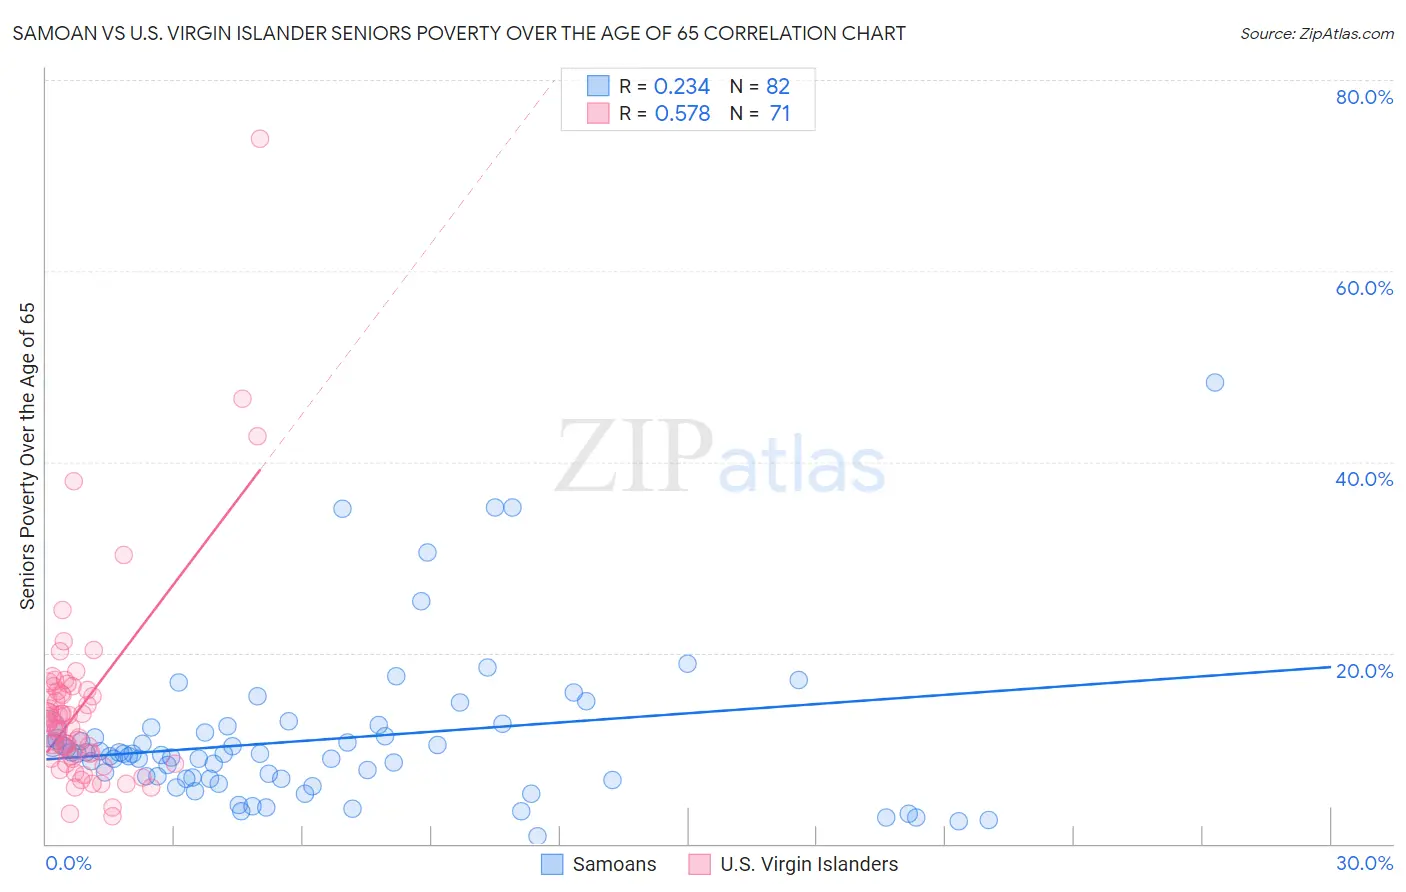
Samoan vs U.S. Virgin Islander Seniors Poverty Over the Age of 65 Correlation Chart
The statistical analysis conducted on geographies consisting of 224,422,356 people shows a weak positive correlation between the proportion of Samoans and poverty level among seniors over the age of 65 in the United States with a correlation coefficient (R) of 0.234 and weighted average of 10.0%. Similarly, the statistical analysis conducted on geographies consisting of 87,442,281 people shows a substantial positive correlation between the proportion of U.S. Virgin Islanders and poverty level among seniors over the age of 65 in the United States with a correlation coefficient (R) of 0.578 and weighted average of 14.0%, a difference of 40.5%.
Seniors Poverty Over the Age of 65 Correlation Summary
| Measurement | Samoan | U.S. Virgin Islander |
| Minimum | 0.73% | 2.9% |
| Maximum | 48.3% | 73.8% |
| Range | 47.5% | 70.9% |
| Mean | 10.9% | 14.5% |
| Median | 9.4% | 12.7% |
| Interquartile 25% (IQ1) | 6.8% | 8.9% |
| Interquartile 75% (IQ3) | 12.1% | 16.1% |
| Interquartile Range (IQR) | 5.3% | 7.2% |
| Standard Deviation (Sample) | 8.0% | 10.6% |
| Standard Deviation (Population) | 8.0% | 10.5% |
Similar Demographics by Seniors Poverty Over the Age of 65
Demographics Similar to Samoans by Seniors Poverty Over the Age of 65
In terms of seniors poverty over the age of 65, the demographic groups most similar to Samoans are Yugoslavian (10.0%, a difference of 0.040%), Palestinian (10.0%, a difference of 0.060%), Russian (10.0%, a difference of 0.090%), Turkish (10.0%, a difference of 0.11%), and Immigrants from Czechoslovakia (10.0%, a difference of 0.20%).
| Demographics | Rating | Rank | Seniors Poverty Over the Age of 65 |
| Macedonians | 98.8 /100 | #63 | Exceptional 9.9% |
| Immigrants | North America | 98.8 /100 | #64 | Exceptional 9.9% |
| Pennsylvania Germans | 98.7 /100 | #65 | Exceptional 9.9% |
| Immigrants | Netherlands | 98.7 /100 | #66 | Exceptional 9.9% |
| Immigrants | Austria | 98.6 /100 | #67 | Exceptional 9.9% |
| Canadians | 98.5 /100 | #68 | Exceptional 9.9% |
| Australians | 98.4 /100 | #69 | Exceptional 9.9% |
| Samoans | 98.0 /100 | #70 | Exceptional 10.0% |
| Yugoslavians | 97.9 /100 | #71 | Exceptional 10.0% |
| Palestinians | 97.9 /100 | #72 | Exceptional 10.0% |
| Russians | 97.9 /100 | #73 | Exceptional 10.0% |
| Turks | 97.9 /100 | #74 | Exceptional 10.0% |
| Immigrants | Czechoslovakia | 97.8 /100 | #75 | Exceptional 10.0% |
| New Zealanders | 97.7 /100 | #76 | Exceptional 10.0% |
| Immigrants | South Africa | 97.7 /100 | #77 | Exceptional 10.0% |
Demographics Similar to U.S. Virgin Islanders by Seniors Poverty Over the Age of 65
In terms of seniors poverty over the age of 65, the demographic groups most similar to U.S. Virgin Islanders are Yup'ik (14.1%, a difference of 0.080%), Immigrants from Bangladesh (14.1%, a difference of 0.19%), Immigrants from Uzbekistan (14.0%, a difference of 0.21%), Ecuadorian (14.0%, a difference of 0.28%), and Immigrants from Belize (14.0%, a difference of 0.36%).
| Demographics | Rating | Rank | Seniors Poverty Over the Age of 65 |
| Cheyenne | 0.0 /100 | #294 | Tragic 13.9% |
| Apache | 0.0 /100 | #295 | Tragic 13.9% |
| Immigrants | Jamaica | 0.0 /100 | #296 | Tragic 13.9% |
| Vietnamese | 0.0 /100 | #297 | Tragic 14.0% |
| Immigrants | Belize | 0.0 /100 | #298 | Tragic 14.0% |
| Ecuadorians | 0.0 /100 | #299 | Tragic 14.0% |
| Immigrants | Uzbekistan | 0.0 /100 | #300 | Tragic 14.0% |
| U.S. Virgin Islanders | 0.0 /100 | #301 | Tragic 14.0% |
| Yup'ik | 0.0 /100 | #302 | Tragic 14.1% |
| Immigrants | Bangladesh | 0.0 /100 | #303 | Tragic 14.1% |
| West Indians | 0.0 /100 | #304 | Tragic 14.1% |
| Immigrants | Trinidad and Tobago | 0.0 /100 | #305 | Tragic 14.1% |
| Immigrants | Latin America | 0.0 /100 | #306 | Tragic 14.2% |
| Immigrants | West Indies | 0.0 /100 | #307 | Tragic 14.2% |
| Trinidadians and Tobagonians | 0.0 /100 | #308 | Tragic 14.2% |