Central American vs U.S. Virgin Islander Seniors Poverty Over the Age of 65
COMPARE
Central American
U.S. Virgin Islander
Seniors Poverty Over the Age of 65
Seniors Poverty Over the Age of 65 Comparison
Central Americans
U.S. Virgin Islanders
13.4%
SENIORS POVERTY OVER THE AGE OF 65
0.0/ 100
METRIC RATING
283rd/ 347
METRIC RANK
14.0%
SENIORS POVERTY OVER THE AGE OF 65
0.0/ 100
METRIC RATING
301st/ 347
METRIC RANK
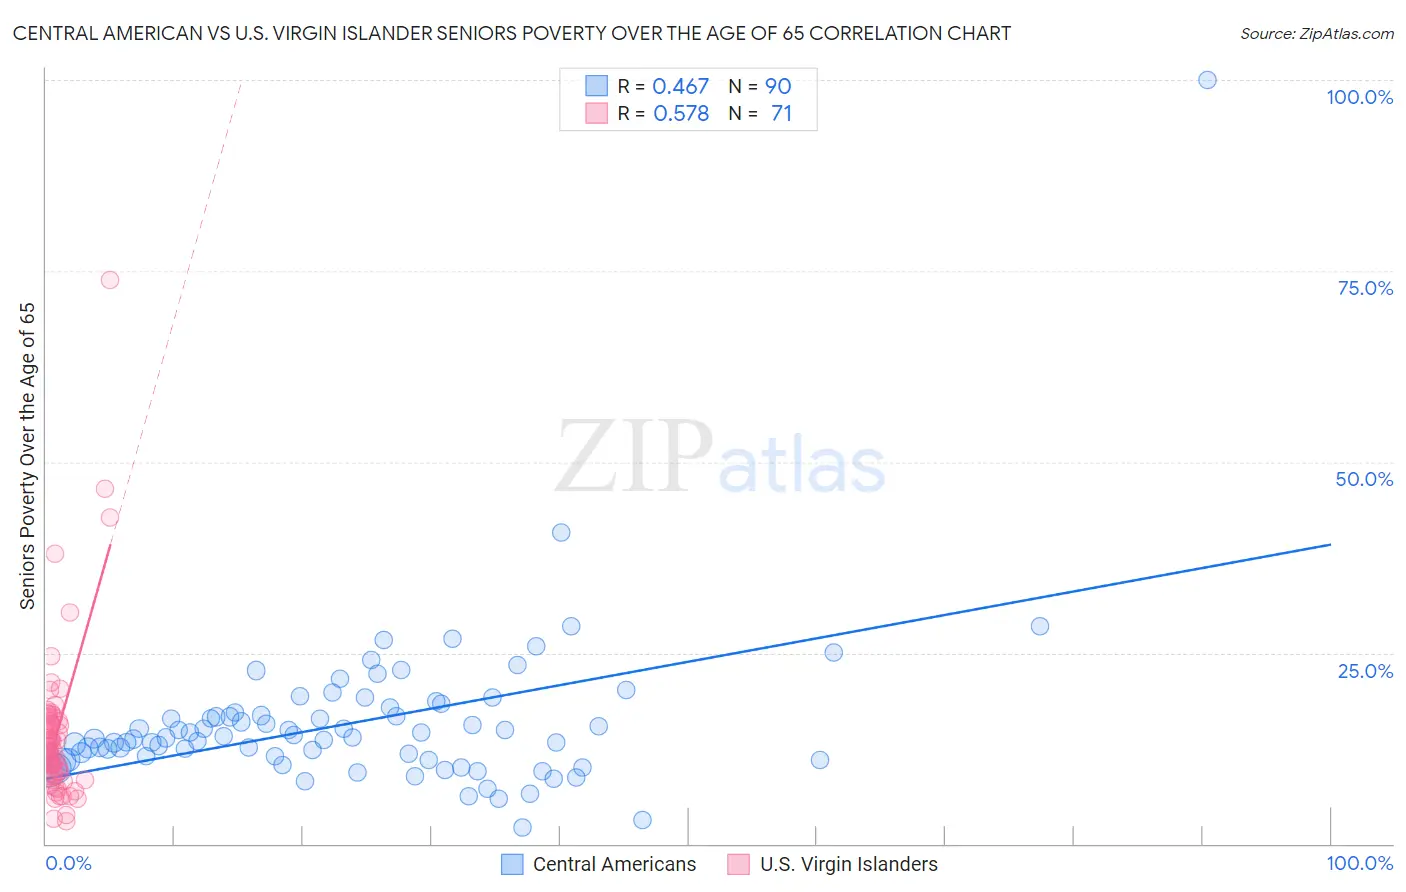
Central American vs U.S. Virgin Islander Seniors Poverty Over the Age of 65 Correlation Chart
The statistical analysis conducted on geographies consisting of 501,778,259 people shows a moderate positive correlation between the proportion of Central Americans and poverty level among seniors over the age of 65 in the United States with a correlation coefficient (R) of 0.467 and weighted average of 13.4%. Similarly, the statistical analysis conducted on geographies consisting of 87,442,281 people shows a substantial positive correlation between the proportion of U.S. Virgin Islanders and poverty level among seniors over the age of 65 in the United States with a correlation coefficient (R) of 0.578 and weighted average of 14.0%, a difference of 5.0%.
Seniors Poverty Over the Age of 65 Correlation Summary
| Measurement | Central American | U.S. Virgin Islander |
| Minimum | 2.1% | 2.9% |
| Maximum | 100.0% | 73.8% |
| Range | 97.9% | 70.9% |
| Mean | 15.8% | 14.5% |
| Median | 13.9% | 12.7% |
| Interquartile 25% (IQ1) | 11.0% | 8.9% |
| Interquartile 75% (IQ3) | 17.2% | 16.1% |
| Interquartile Range (IQR) | 6.3% | 7.2% |
| Standard Deviation (Sample) | 10.8% | 10.6% |
| Standard Deviation (Population) | 10.8% | 10.5% |
Demographics Similar to Central Americans and U.S. Virgin Islanders by Seniors Poverty Over the Age of 65
In terms of seniors poverty over the age of 65, the demographic groups most similar to Central Americans are Senegalese (13.3%, a difference of 0.82%), Colville (13.5%, a difference of 0.89%), Guatemalan (13.5%, a difference of 1.1%), Immigrants from Senegal (13.6%, a difference of 1.4%), and Immigrants from Mexico (13.6%, a difference of 1.5%). Similarly, the demographic groups most similar to U.S. Virgin Islanders are Yup'ik (14.1%, a difference of 0.080%), Immigrants from Uzbekistan (14.0%, a difference of 0.21%), Ecuadorian (14.0%, a difference of 0.28%), Immigrants from Belize (14.0%, a difference of 0.36%), and Vietnamese (14.0%, a difference of 0.64%).
| Demographics | Rating | Rank | Seniors Poverty Over the Age of 65 |
| Senegalese | 0.0 /100 | #282 | Tragic 13.3% |
| Central Americans | 0.0 /100 | #283 | Tragic 13.4% |
| Colville | 0.0 /100 | #284 | Tragic 13.5% |
| Guatemalans | 0.0 /100 | #285 | Tragic 13.5% |
| Immigrants | Senegal | 0.0 /100 | #286 | Tragic 13.6% |
| Immigrants | Mexico | 0.0 /100 | #287 | Tragic 13.6% |
| Belizeans | 0.0 /100 | #288 | Tragic 13.6% |
| Jamaicans | 0.0 /100 | #289 | Tragic 13.6% |
| Immigrants | Central America | 0.0 /100 | #290 | Tragic 13.6% |
| Blacks/African Americans | 0.0 /100 | #291 | Tragic 13.7% |
| Spanish American Indians | 0.0 /100 | #292 | Tragic 13.8% |
| Immigrants | Guatemala | 0.0 /100 | #293 | Tragic 13.8% |
| Cheyenne | 0.0 /100 | #294 | Tragic 13.9% |
| Apache | 0.0 /100 | #295 | Tragic 13.9% |
| Immigrants | Jamaica | 0.0 /100 | #296 | Tragic 13.9% |
| Vietnamese | 0.0 /100 | #297 | Tragic 14.0% |
| Immigrants | Belize | 0.0 /100 | #298 | Tragic 14.0% |
| Ecuadorians | 0.0 /100 | #299 | Tragic 14.0% |
| Immigrants | Uzbekistan | 0.0 /100 | #300 | Tragic 14.0% |
| U.S. Virgin Islanders | 0.0 /100 | #301 | Tragic 14.0% |
| Yup'ik | 0.0 /100 | #302 | Tragic 14.1% |