Pakistani vs Immigrants from Guyana Seniors Poverty Over the Age of 65
COMPARE
Pakistani
Immigrants from Guyana
Seniors Poverty Over the Age of 65
Seniors Poverty Over the Age of 65 Comparison
Pakistanis
Immigrants from Guyana
10.3%
SENIORS POVERTY OVER THE AGE OF 65
92.2/ 100
METRIC RATING
116th/ 347
METRIC RANK
14.5%
SENIORS POVERTY OVER THE AGE OF 65
0.0/ 100
METRIC RATING
316th/ 347
METRIC RANK
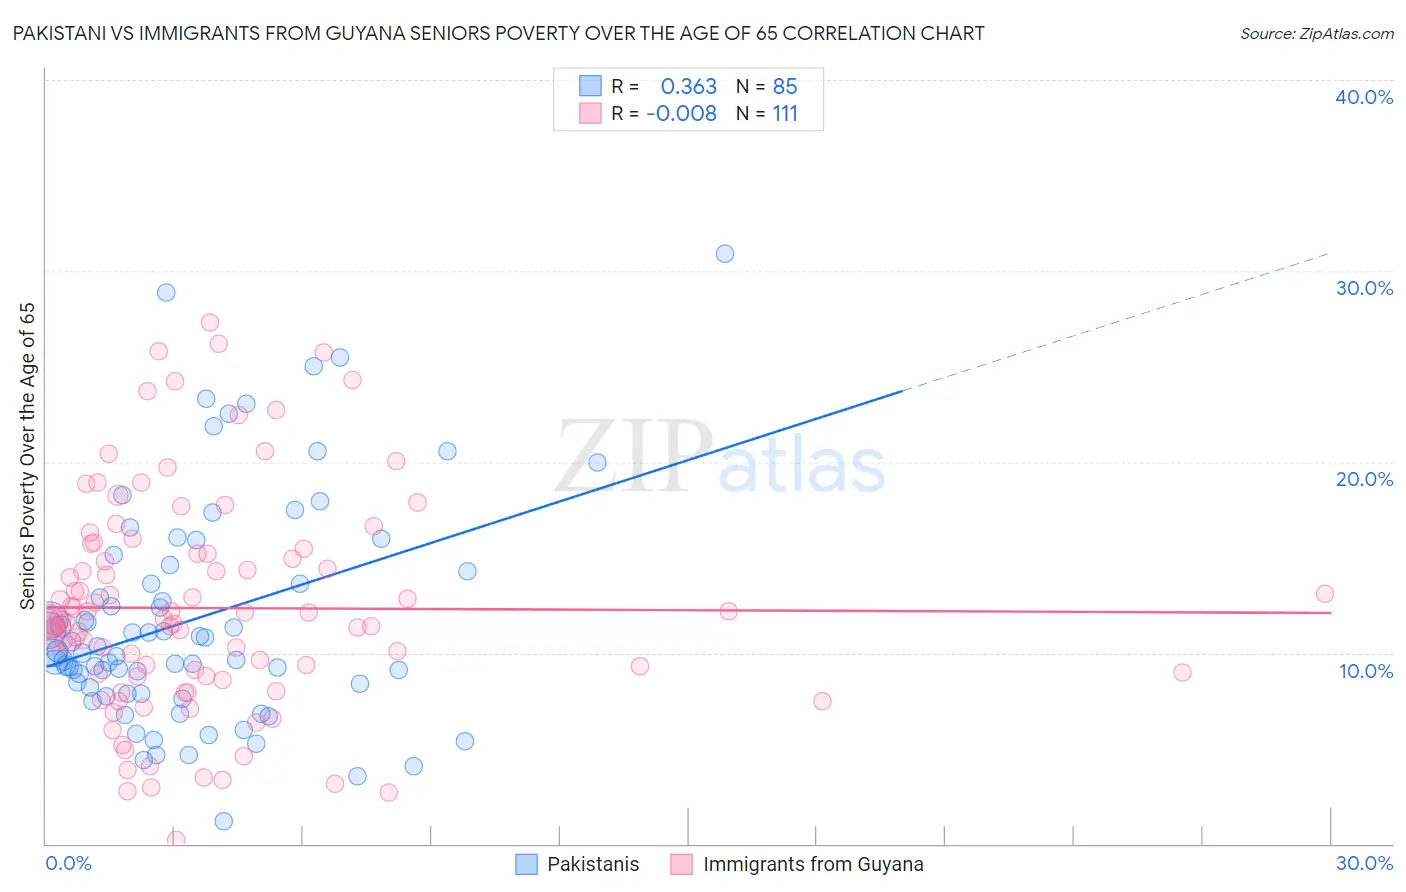
Pakistani vs Immigrants from Guyana Seniors Poverty Over the Age of 65 Correlation Chart
The statistical analysis conducted on geographies consisting of 334,315,212 people shows a mild positive correlation between the proportion of Pakistanis and poverty level among seniors over the age of 65 in the United States with a correlation coefficient (R) of 0.363 and weighted average of 10.3%. Similarly, the statistical analysis conducted on geographies consisting of 183,396,619 people shows no correlation between the proportion of Immigrants from Guyana and poverty level among seniors over the age of 65 in the United States with a correlation coefficient (R) of -0.008 and weighted average of 14.5%, a difference of 39.9%.
Seniors Poverty Over the Age of 65 Correlation Summary
| Measurement | Pakistani | Immigrants from Guyana |
| Minimum | 1.2% | 0.21% |
| Maximum | 30.9% | 27.3% |
| Range | 29.7% | 27.1% |
| Mean | 11.8% | 12.3% |
| Median | 10.0% | 11.7% |
| Interquartile 25% (IQ1) | 8.0% | 8.8% |
| Interquartile 75% (IQ3) | 14.4% | 15.2% |
| Interquartile Range (IQR) | 6.4% | 6.4% |
| Standard Deviation (Sample) | 5.9% | 5.7% |
| Standard Deviation (Population) | 5.9% | 5.6% |
Similar Demographics by Seniors Poverty Over the Age of 65
Demographics Similar to Pakistanis by Seniors Poverty Over the Age of 65
In terms of seniors poverty over the age of 65, the demographic groups most similar to Pakistanis are Lebanese (10.3%, a difference of 0.060%), Okinawan (10.4%, a difference of 0.14%), Immigrants from Italy (10.3%, a difference of 0.15%), Immigrants from Denmark (10.3%, a difference of 0.19%), and Immigrants from Western Europe (10.4%, a difference of 0.33%).
| Demographics | Rating | Rank | Seniors Poverty Over the Age of 65 |
| Syrians | 93.8 /100 | #109 | Exceptional 10.3% |
| Immigrants | Zimbabwe | 93.5 /100 | #110 | Exceptional 10.3% |
| Immigrants | Belgium | 93.4 /100 | #111 | Exceptional 10.3% |
| Immigrants | Korea | 93.3 /100 | #112 | Exceptional 10.3% |
| Immigrants | Romania | 93.3 /100 | #113 | Exceptional 10.3% |
| Immigrants | Denmark | 92.7 /100 | #114 | Exceptional 10.3% |
| Immigrants | Italy | 92.6 /100 | #115 | Exceptional 10.3% |
| Pakistanis | 92.2 /100 | #116 | Exceptional 10.3% |
| Lebanese | 92.0 /100 | #117 | Exceptional 10.3% |
| Okinawans | 91.7 /100 | #118 | Exceptional 10.4% |
| Immigrants | Western Europe | 91.1 /100 | #119 | Exceptional 10.4% |
| Immigrants | Bosnia and Herzegovina | 90.8 /100 | #120 | Exceptional 10.4% |
| Immigrants | Iraq | 90.7 /100 | #121 | Exceptional 10.4% |
| Immigrants | Moldova | 90.7 /100 | #122 | Exceptional 10.4% |
| Hmong | 90.0 /100 | #123 | Exceptional 10.4% |
Demographics Similar to Immigrants from Guyana by Seniors Poverty Over the Age of 65
In terms of seniors poverty over the age of 65, the demographic groups most similar to Immigrants from Guyana are Haitian (14.5%, a difference of 0.030%), Immigrants from Ecuador (14.4%, a difference of 0.21%), Guyanese (14.4%, a difference of 0.24%), Immigrants from Honduras (14.5%, a difference of 0.24%), and Barbadian (14.4%, a difference of 0.64%).
| Demographics | Rating | Rank | Seniors Poverty Over the Age of 65 |
| Hondurans | 0.0 /100 | #309 | Tragic 14.2% |
| Bahamians | 0.0 /100 | #310 | Tragic 14.2% |
| Natives/Alaskans | 0.0 /100 | #311 | Tragic 14.2% |
| Hispanics or Latinos | 0.0 /100 | #312 | Tragic 14.3% |
| Barbadians | 0.0 /100 | #313 | Tragic 14.4% |
| Guyanese | 0.0 /100 | #314 | Tragic 14.4% |
| Immigrants | Ecuador | 0.0 /100 | #315 | Tragic 14.4% |
| Immigrants | Guyana | 0.0 /100 | #316 | Tragic 14.5% |
| Haitians | 0.0 /100 | #317 | Tragic 14.5% |
| Immigrants | Honduras | 0.0 /100 | #318 | Tragic 14.5% |
| Cape Verdeans | 0.0 /100 | #319 | Tragic 14.7% |
| Immigrants | Haiti | 0.0 /100 | #320 | Tragic 14.7% |
| Houma | 0.0 /100 | #321 | Tragic 14.7% |
| Immigrants | Barbados | 0.0 /100 | #322 | Tragic 14.8% |
| Yakama | 0.0 /100 | #323 | Tragic 14.8% |