Pakistani vs Marshallese Seniors Poverty Over the Age of 65
COMPARE
Pakistani
Marshallese
Seniors Poverty Over the Age of 65
Seniors Poverty Over the Age of 65 Comparison
Pakistanis
Marshallese
10.3%
SENIORS POVERTY OVER THE AGE OF 65
92.2/ 100
METRIC RATING
116th/ 347
METRIC RANK
10.2%
SENIORS POVERTY OVER THE AGE OF 65
95.3/ 100
METRIC RATING
100th/ 347
METRIC RANK
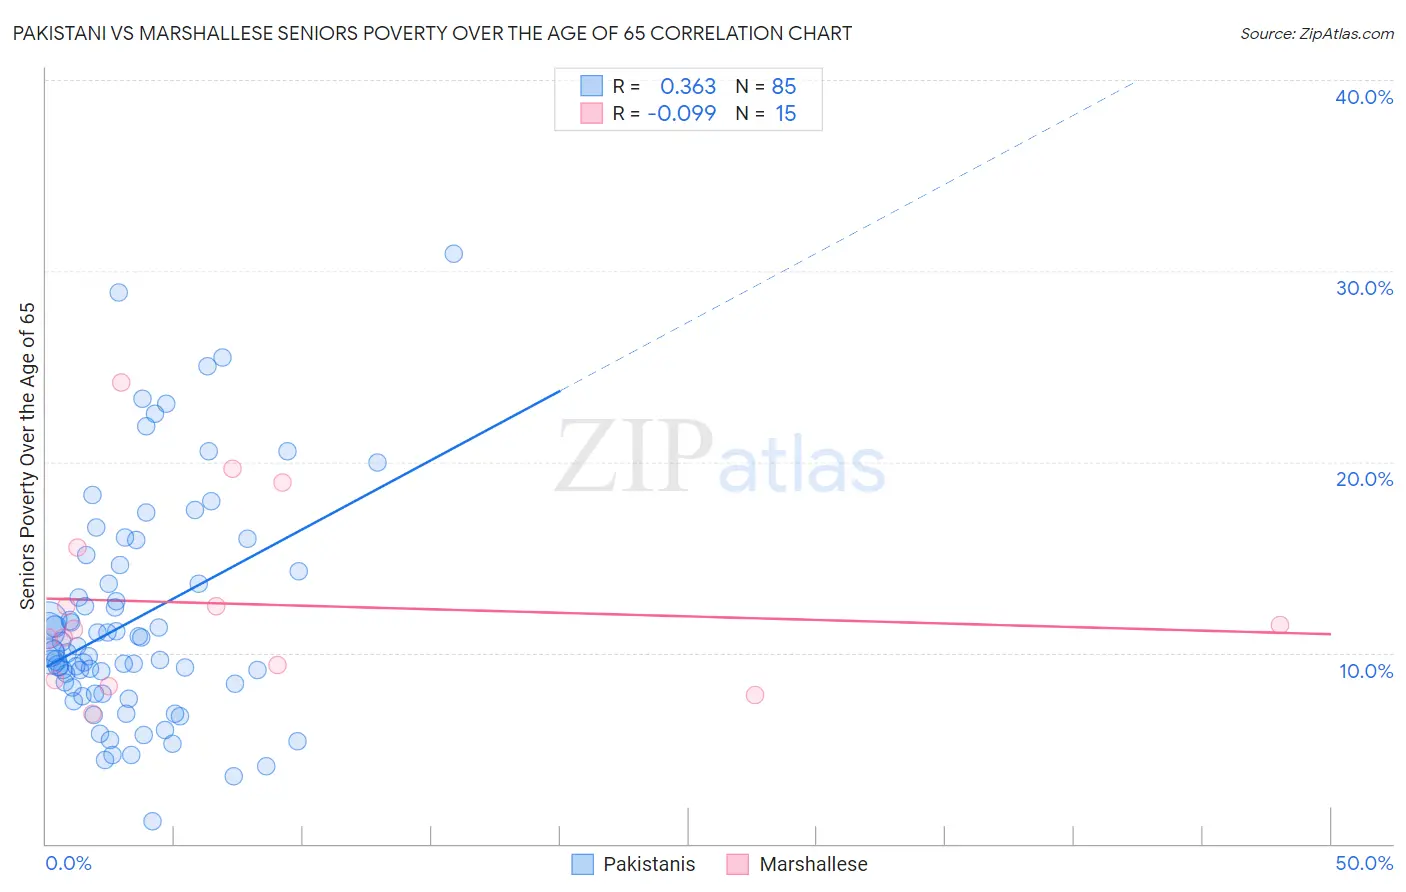
Pakistani vs Marshallese Seniors Poverty Over the Age of 65 Correlation Chart
The statistical analysis conducted on geographies consisting of 334,315,212 people shows a mild positive correlation between the proportion of Pakistanis and poverty level among seniors over the age of 65 in the United States with a correlation coefficient (R) of 0.363 and weighted average of 10.3%. Similarly, the statistical analysis conducted on geographies consisting of 14,747,629 people shows a slight negative correlation between the proportion of Marshallese and poverty level among seniors over the age of 65 in the United States with a correlation coefficient (R) of -0.099 and weighted average of 10.2%, a difference of 1.3%.
Seniors Poverty Over the Age of 65 Correlation Summary
| Measurement | Pakistani | Marshallese |
| Minimum | 1.2% | 6.8% |
| Maximum | 30.9% | 24.1% |
| Range | 29.7% | 17.3% |
| Mean | 11.8% | 12.5% |
| Median | 10.0% | 11.2% |
| Interquartile 25% (IQ1) | 8.0% | 8.6% |
| Interquartile 75% (IQ3) | 14.4% | 15.5% |
| Interquartile Range (IQR) | 6.4% | 6.9% |
| Standard Deviation (Sample) | 5.9% | 4.9% |
| Standard Deviation (Population) | 5.9% | 4.8% |
Demographics Similar to Pakistanis and Marshallese by Seniors Poverty Over the Age of 65
In terms of seniors poverty over the age of 65, the demographic groups most similar to Pakistanis are Lebanese (10.3%, a difference of 0.060%), Okinawan (10.4%, a difference of 0.14%), Immigrants from Italy (10.3%, a difference of 0.15%), Immigrants from Denmark (10.3%, a difference of 0.19%), and Immigrants from Romania (10.3%, a difference of 0.38%). Similarly, the demographic groups most similar to Marshallese are Immigrants from Kuwait (10.2%, a difference of 0.070%), Cypriot (10.2%, a difference of 0.070%), Immigrants from Jordan (10.2%, a difference of 0.32%), Delaware (10.2%, a difference of 0.42%), and Icelander (10.3%, a difference of 0.47%).
| Demographics | Rating | Rank | Seniors Poverty Over the Age of 65 |
| Immigrants | Kuwait | 95.5 /100 | #98 | Exceptional 10.2% |
| Cypriots | 95.5 /100 | #99 | Exceptional 10.2% |
| Marshallese | 95.3 /100 | #100 | Exceptional 10.2% |
| Immigrants | Jordan | 94.7 /100 | #101 | Exceptional 10.2% |
| Delaware | 94.5 /100 | #102 | Exceptional 10.2% |
| Icelanders | 94.4 /100 | #103 | Exceptional 10.3% |
| South Africans | 94.3 /100 | #104 | Exceptional 10.3% |
| Aleuts | 94.1 /100 | #105 | Exceptional 10.3% |
| Kenyans | 94.1 /100 | #106 | Exceptional 10.3% |
| Hawaiians | 93.9 /100 | #107 | Exceptional 10.3% |
| Immigrants | Croatia | 93.9 /100 | #108 | Exceptional 10.3% |
| Syrians | 93.8 /100 | #109 | Exceptional 10.3% |
| Immigrants | Zimbabwe | 93.5 /100 | #110 | Exceptional 10.3% |
| Immigrants | Belgium | 93.4 /100 | #111 | Exceptional 10.3% |
| Immigrants | Korea | 93.3 /100 | #112 | Exceptional 10.3% |
| Immigrants | Romania | 93.3 /100 | #113 | Exceptional 10.3% |
| Immigrants | Denmark | 92.7 /100 | #114 | Exceptional 10.3% |
| Immigrants | Italy | 92.6 /100 | #115 | Exceptional 10.3% |
| Pakistanis | 92.2 /100 | #116 | Exceptional 10.3% |
| Lebanese | 92.0 /100 | #117 | Exceptional 10.3% |
| Okinawans | 91.7 /100 | #118 | Exceptional 10.4% |