Immigrants from Ireland vs U.S. Virgin Islander Seniors Poverty Over the Age of 65
COMPARE
Immigrants from Ireland
U.S. Virgin Islander
Seniors Poverty Over the Age of 65
Seniors Poverty Over the Age of 65 Comparison
Immigrants from Ireland
U.S. Virgin Islanders
10.0%
SENIORS POVERTY OVER THE AGE OF 65
97.5/ 100
METRIC RATING
79th/ 347
METRIC RANK
14.0%
SENIORS POVERTY OVER THE AGE OF 65
0.0/ 100
METRIC RATING
301st/ 347
METRIC RANK
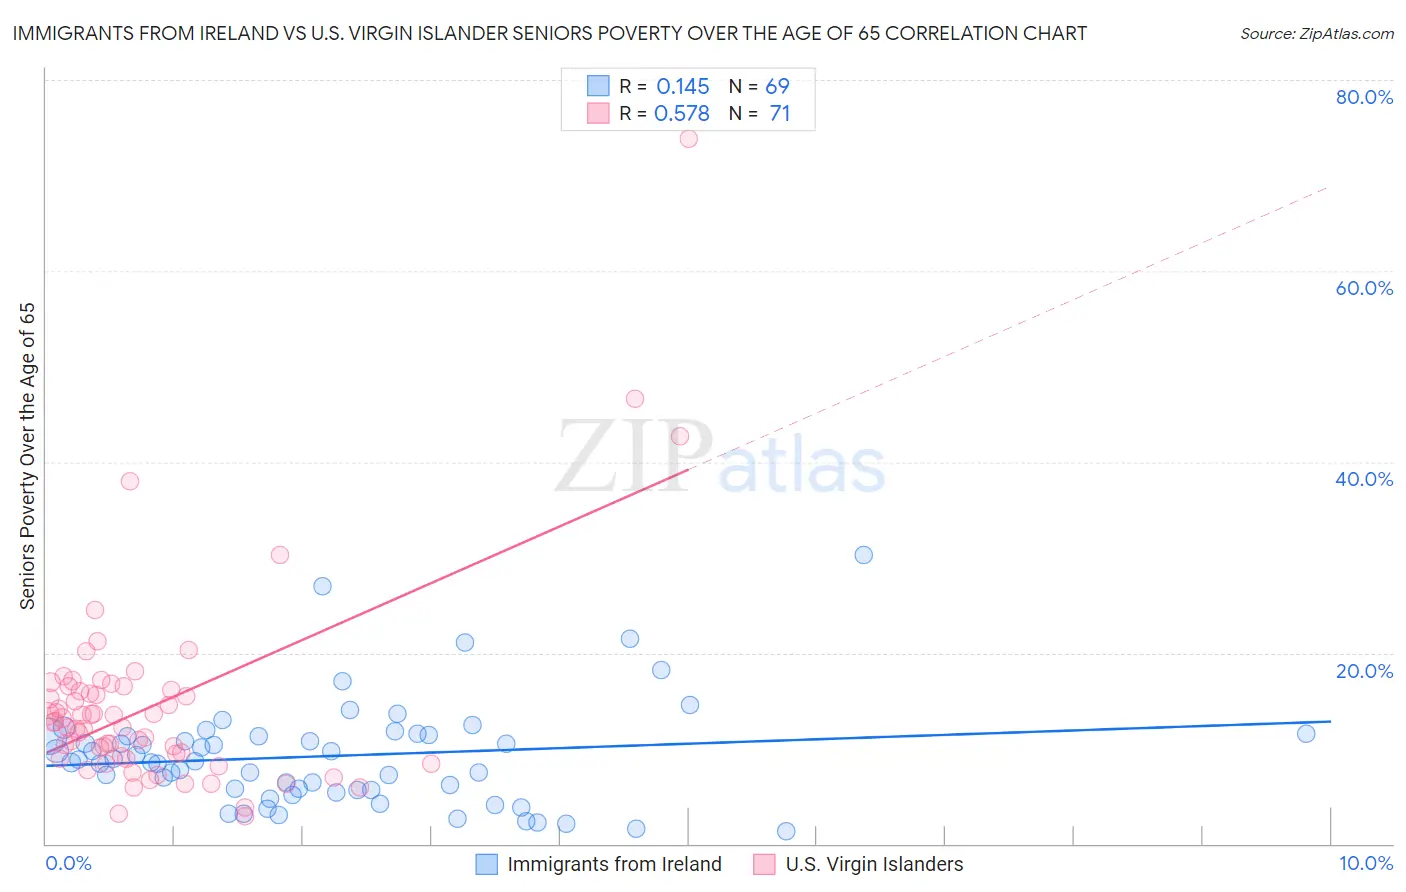
Immigrants from Ireland vs U.S. Virgin Islander Seniors Poverty Over the Age of 65 Correlation Chart
The statistical analysis conducted on geographies consisting of 240,436,919 people shows a poor positive correlation between the proportion of Immigrants from Ireland and poverty level among seniors over the age of 65 in the United States with a correlation coefficient (R) of 0.145 and weighted average of 10.0%. Similarly, the statistical analysis conducted on geographies consisting of 87,442,281 people shows a substantial positive correlation between the proportion of U.S. Virgin Islanders and poverty level among seniors over the age of 65 in the United States with a correlation coefficient (R) of 0.578 and weighted average of 14.0%, a difference of 39.8%.
Seniors Poverty Over the Age of 65 Correlation Summary
| Measurement | Immigrants from Ireland | U.S. Virgin Islander |
| Minimum | 1.3% | 2.9% |
| Maximum | 30.3% | 73.8% |
| Range | 29.0% | 70.9% |
| Mean | 9.2% | 14.5% |
| Median | 8.7% | 12.7% |
| Interquartile 25% (IQ1) | 5.6% | 8.9% |
| Interquartile 75% (IQ3) | 11.3% | 16.1% |
| Interquartile Range (IQR) | 5.7% | 7.2% |
| Standard Deviation (Sample) | 5.5% | 10.6% |
| Standard Deviation (Population) | 5.4% | 10.5% |
Similar Demographics by Seniors Poverty Over the Age of 65
Demographics Similar to Immigrants from Ireland by Seniors Poverty Over the Age of 65
In terms of seniors poverty over the age of 65, the demographic groups most similar to Immigrants from Ireland are White/Caucasian (10.0%, a difference of 0.010%), Korean (10.1%, a difference of 0.10%), Immigrants from Sri Lanka (10.1%, a difference of 0.13%), Immigrants from Bolivia (10.1%, a difference of 0.20%), and Immigrants from Poland (10.1%, a difference of 0.22%).
| Demographics | Rating | Rank | Seniors Poverty Over the Age of 65 |
| Palestinians | 97.9 /100 | #72 | Exceptional 10.0% |
| Russians | 97.9 /100 | #73 | Exceptional 10.0% |
| Turks | 97.9 /100 | #74 | Exceptional 10.0% |
| Immigrants | Czechoslovakia | 97.8 /100 | #75 | Exceptional 10.0% |
| New Zealanders | 97.7 /100 | #76 | Exceptional 10.0% |
| Immigrants | South Africa | 97.7 /100 | #77 | Exceptional 10.0% |
| Whites/Caucasians | 97.5 /100 | #78 | Exceptional 10.0% |
| Immigrants | Ireland | 97.5 /100 | #79 | Exceptional 10.0% |
| Koreans | 97.4 /100 | #80 | Exceptional 10.1% |
| Immigrants | Sri Lanka | 97.3 /100 | #81 | Exceptional 10.1% |
| Immigrants | Bolivia | 97.3 /100 | #82 | Exceptional 10.1% |
| Immigrants | Poland | 97.2 /100 | #83 | Exceptional 10.1% |
| Immigrants | Afghanistan | 97.2 /100 | #84 | Exceptional 10.1% |
| Immigrants | Nepal | 97.2 /100 | #85 | Exceptional 10.1% |
| Romanians | 97.2 /100 | #86 | Exceptional 10.1% |
Demographics Similar to U.S. Virgin Islanders by Seniors Poverty Over the Age of 65
In terms of seniors poverty over the age of 65, the demographic groups most similar to U.S. Virgin Islanders are Yup'ik (14.1%, a difference of 0.080%), Immigrants from Bangladesh (14.1%, a difference of 0.19%), Immigrants from Uzbekistan (14.0%, a difference of 0.21%), Ecuadorian (14.0%, a difference of 0.28%), and Immigrants from Belize (14.0%, a difference of 0.36%).
| Demographics | Rating | Rank | Seniors Poverty Over the Age of 65 |
| Cheyenne | 0.0 /100 | #294 | Tragic 13.9% |
| Apache | 0.0 /100 | #295 | Tragic 13.9% |
| Immigrants | Jamaica | 0.0 /100 | #296 | Tragic 13.9% |
| Vietnamese | 0.0 /100 | #297 | Tragic 14.0% |
| Immigrants | Belize | 0.0 /100 | #298 | Tragic 14.0% |
| Ecuadorians | 0.0 /100 | #299 | Tragic 14.0% |
| Immigrants | Uzbekistan | 0.0 /100 | #300 | Tragic 14.0% |
| U.S. Virgin Islanders | 0.0 /100 | #301 | Tragic 14.0% |
| Yup'ik | 0.0 /100 | #302 | Tragic 14.1% |
| Immigrants | Bangladesh | 0.0 /100 | #303 | Tragic 14.1% |
| West Indians | 0.0 /100 | #304 | Tragic 14.1% |
| Immigrants | Trinidad and Tobago | 0.0 /100 | #305 | Tragic 14.1% |
| Immigrants | Latin America | 0.0 /100 | #306 | Tragic 14.2% |
| Immigrants | West Indies | 0.0 /100 | #307 | Tragic 14.2% |
| Trinidadians and Tobagonians | 0.0 /100 | #308 | Tragic 14.2% |