Pakistani vs Immigrants from Denmark Female Poverty Among 18-24 Year Olds
COMPARE
Pakistani
Immigrants from Denmark
Female Poverty Among 18-24 Year Olds
Female Poverty Among 18-24 Year Olds Comparison
Pakistanis
Immigrants from Denmark
19.8%
FEMALE POVERTY AMONG 18-24 YEAR OLDS
74.1/ 100
METRIC RATING
160th/ 347
METRIC RANK
20.8%
FEMALE POVERTY AMONG 18-24 YEAR OLDS
5.8/ 100
METRIC RATING
233rd/ 347
METRIC RANK
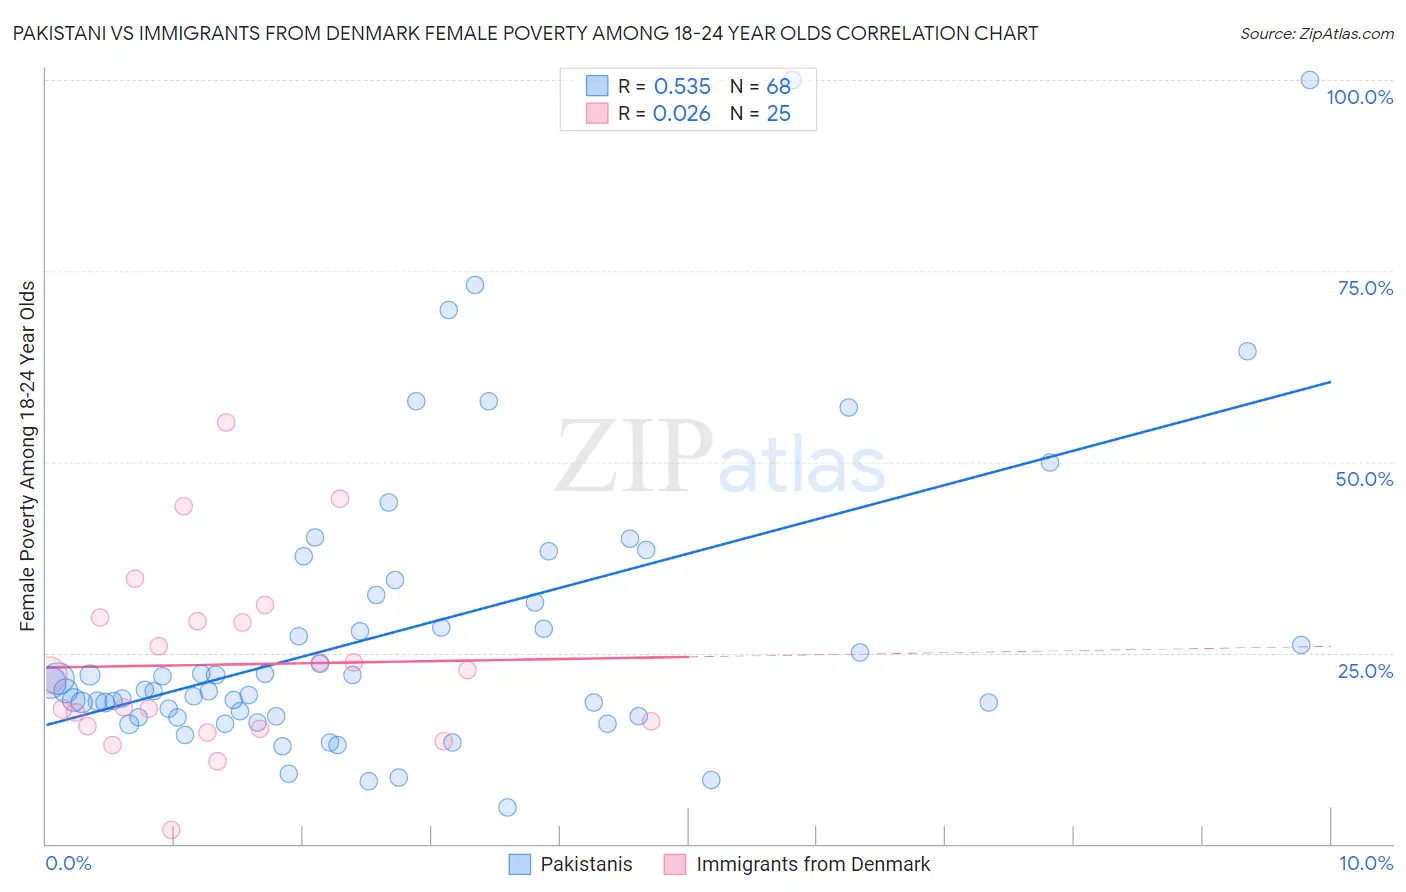
Pakistani vs Immigrants from Denmark Female Poverty Among 18-24 Year Olds Correlation Chart
The statistical analysis conducted on geographies consisting of 330,227,918 people shows a substantial positive correlation between the proportion of Pakistanis and poverty level among females between the ages 18 and 24 in the United States with a correlation coefficient (R) of 0.535 and weighted average of 19.8%. Similarly, the statistical analysis conducted on geographies consisting of 134,710,219 people shows no correlation between the proportion of Immigrants from Denmark and poverty level among females between the ages 18 and 24 in the United States with a correlation coefficient (R) of 0.026 and weighted average of 20.8%, a difference of 4.8%.
Female Poverty Among 18-24 Year Olds Correlation Summary
| Measurement | Pakistani | Immigrants from Denmark |
| Minimum | 4.7% | 1.8% |
| Maximum | 100.0% | 55.2% |
| Range | 95.3% | 53.4% |
| Mean | 27.7% | 23.5% |
| Median | 20.0% | 22.1% |
| Interquartile 25% (IQ1) | 16.7% | 15.2% |
| Interquartile 75% (IQ3) | 32.0% | 29.4% |
| Interquartile Range (IQR) | 15.4% | 14.2% |
| Standard Deviation (Sample) | 19.5% | 12.0% |
| Standard Deviation (Population) | 19.4% | 11.8% |
Similar Demographics by Female Poverty Among 18-24 Year Olds
Demographics Similar to Pakistanis by Female Poverty Among 18-24 Year Olds
In terms of female poverty among 18-24 year olds, the demographic groups most similar to Pakistanis are Immigrants from Belize (19.8%, a difference of 0.0%), Trinidadian and Tobagonian (19.8%, a difference of 0.020%), French Canadian (19.9%, a difference of 0.070%), Immigrants from Lebanon (19.8%, a difference of 0.080%), and Danish (19.8%, a difference of 0.090%).
| Demographics | Rating | Rank | Female Poverty Among 18-24 Year Olds |
| Immigrants | Japan | 78.1 /100 | #153 | Good 19.8% |
| Immigrants | Zimbabwe | 76.7 /100 | #154 | Good 19.8% |
| Hungarians | 76.6 /100 | #155 | Good 19.8% |
| Immigrants | Belgium | 76.4 /100 | #156 | Good 19.8% |
| Danes | 75.5 /100 | #157 | Good 19.8% |
| Immigrants | Lebanon | 75.3 /100 | #158 | Good 19.8% |
| Trinidadians and Tobagonians | 74.4 /100 | #159 | Good 19.8% |
| Pakistanis | 74.1 /100 | #160 | Good 19.8% |
| Immigrants | Belize | 74.1 /100 | #161 | Good 19.8% |
| French Canadians | 73.0 /100 | #162 | Good 19.9% |
| Malaysians | 72.7 /100 | #163 | Good 19.9% |
| Central Americans | 70.0 /100 | #164 | Good 19.9% |
| Eastern Europeans | 69.3 /100 | #165 | Good 19.9% |
| Belgians | 69.1 /100 | #166 | Good 19.9% |
| Czechoslovakians | 61.8 /100 | #167 | Good 20.0% |
Demographics Similar to Immigrants from Denmark by Female Poverty Among 18-24 Year Olds
In terms of female poverty among 18-24 year olds, the demographic groups most similar to Immigrants from Denmark are Finnish (20.8%, a difference of 0.030%), Immigrants from St. Vincent and the Grenadines (20.8%, a difference of 0.040%), Australian (20.8%, a difference of 0.060%), White/Caucasian (20.8%, a difference of 0.060%), and Welsh (20.8%, a difference of 0.10%).
| Demographics | Rating | Rank | Female Poverty Among 18-24 Year Olds |
| Estonians | 7.2 /100 | #226 | Tragic 20.7% |
| Immigrants | Sweden | 6.8 /100 | #227 | Tragic 20.7% |
| Ghanaians | 6.5 /100 | #228 | Tragic 20.8% |
| Australians | 6.1 /100 | #229 | Tragic 20.8% |
| Whites/Caucasians | 6.1 /100 | #230 | Tragic 20.8% |
| Immigrants | St. Vincent and the Grenadines | 6.0 /100 | #231 | Tragic 20.8% |
| Finns | 6.0 /100 | #232 | Tragic 20.8% |
| Immigrants | Denmark | 5.8 /100 | #233 | Tragic 20.8% |
| Welsh | 5.4 /100 | #234 | Tragic 20.8% |
| Immigrants | Uganda | 5.1 /100 | #235 | Tragic 20.8% |
| Okinawans | 4.9 /100 | #236 | Tragic 20.8% |
| Scottish | 4.5 /100 | #237 | Tragic 20.9% |
| Immigrants | Singapore | 4.4 /100 | #238 | Tragic 20.9% |
| Immigrants | Guatemala | 4.3 /100 | #239 | Tragic 20.9% |
| Luxembourgers | 4.2 /100 | #240 | Tragic 20.9% |