Immigrants from Afghanistan vs Immigrants from Denmark Single Male Poverty
COMPARE
Immigrants from Afghanistan
Immigrants from Denmark
Single Male Poverty
Single Male Poverty Comparison
Immigrants from Afghanistan
Immigrants from Denmark
10.9%
SINGLE MALE POVERTY
100.0/ 100
METRIC RATING
12th/ 347
METRIC RANK
13.2%
SINGLE MALE POVERTY
8.7/ 100
METRIC RATING
225th/ 347
METRIC RANK
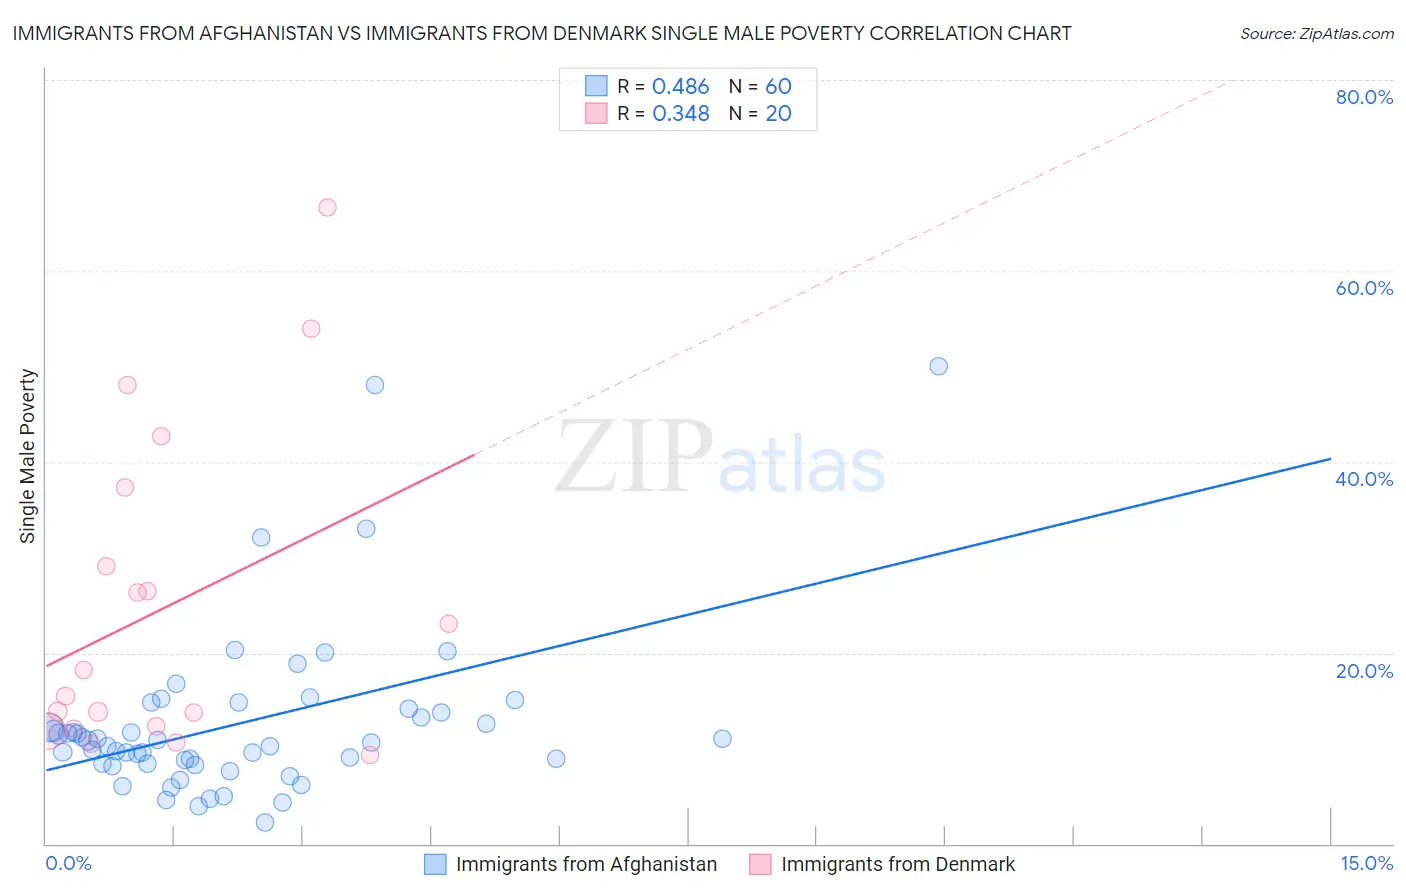
Immigrants from Afghanistan vs Immigrants from Denmark Single Male Poverty Correlation Chart
The statistical analysis conducted on geographies consisting of 139,212,211 people shows a moderate positive correlation between the proportion of Immigrants from Afghanistan and poverty level among single males in the United States with a correlation coefficient (R) of 0.486 and weighted average of 10.9%. Similarly, the statistical analysis conducted on geographies consisting of 127,193,703 people shows a mild positive correlation between the proportion of Immigrants from Denmark and poverty level among single males in the United States with a correlation coefficient (R) of 0.348 and weighted average of 13.2%, a difference of 21.0%.
Single Male Poverty Correlation Summary
| Measurement | Immigrants from Afghanistan | Immigrants from Denmark |
| Minimum | 2.2% | 9.3% |
| Maximum | 50.0% | 66.7% |
| Range | 47.8% | 57.4% |
| Mean | 12.6% | 24.8% |
| Median | 10.7% | 16.8% |
| Interquartile 25% (IQ1) | 8.3% | 12.2% |
| Interquartile 75% (IQ3) | 14.0% | 33.2% |
| Interquartile Range (IQR) | 5.6% | 21.1% |
| Standard Deviation (Sample) | 8.8% | 16.7% |
| Standard Deviation (Population) | 8.8% | 16.2% |
Similar Demographics by Single Male Poverty
Demographics Similar to Immigrants from Afghanistan by Single Male Poverty
In terms of single male poverty, the demographic groups most similar to Immigrants from Afghanistan are Immigrants from Philippines (10.9%, a difference of 0.070%), Immigrants from Fiji (10.9%, a difference of 0.090%), Immigrants from South Central Asia (10.9%, a difference of 0.12%), Taiwanese (10.9%, a difference of 0.15%), and Chinese (11.0%, a difference of 0.69%).
| Demographics | Rating | Rank | Single Male Poverty |
| Tongans | 100.0 /100 | #5 | Exceptional 10.5% |
| Filipinos | 100.0 /100 | #6 | Exceptional 10.6% |
| Afghans | 100.0 /100 | #7 | Exceptional 10.7% |
| Thais | 100.0 /100 | #8 | Exceptional 10.8% |
| Taiwanese | 100.0 /100 | #9 | Exceptional 10.9% |
| Immigrants | Fiji | 100.0 /100 | #10 | Exceptional 10.9% |
| Immigrants | Philippines | 100.0 /100 | #11 | Exceptional 10.9% |
| Immigrants | Afghanistan | 100.0 /100 | #12 | Exceptional 10.9% |
| Immigrants | South Central Asia | 100.0 /100 | #13 | Exceptional 10.9% |
| Chinese | 100.0 /100 | #14 | Exceptional 11.0% |
| Koreans | 100.0 /100 | #15 | Exceptional 11.0% |
| Bhutanese | 100.0 /100 | #16 | Exceptional 11.1% |
| Tsimshian | 100.0 /100 | #17 | Exceptional 11.1% |
| Immigrants | Bolivia | 100.0 /100 | #18 | Exceptional 11.1% |
| Immigrants | Moldova | 100.0 /100 | #19 | Exceptional 11.2% |
Demographics Similar to Immigrants from Denmark by Single Male Poverty
In terms of single male poverty, the demographic groups most similar to Immigrants from Denmark are Somali (13.2%, a difference of 0.050%), Immigrants from the Azores (13.2%, a difference of 0.090%), Jamaican (13.2%, a difference of 0.16%), Immigrants from Western Europe (13.2%, a difference of 0.20%), and New Zealander (13.2%, a difference of 0.29%).
| Demographics | Rating | Rank | Single Male Poverty |
| Scandinavians | 12.9 /100 | #218 | Poor 13.1% |
| Immigrants | Burma/Myanmar | 12.6 /100 | #219 | Poor 13.1% |
| Central Americans | 10.9 /100 | #220 | Poor 13.2% |
| New Zealanders | 10.7 /100 | #221 | Poor 13.2% |
| Immigrants | Western Europe | 10.0 /100 | #222 | Poor 13.2% |
| Immigrants | Azores | 9.3 /100 | #223 | Tragic 13.2% |
| Somalis | 9.1 /100 | #224 | Tragic 13.2% |
| Immigrants | Denmark | 8.7 /100 | #225 | Tragic 13.2% |
| Jamaicans | 7.7 /100 | #226 | Tragic 13.2% |
| Haitians | 7.0 /100 | #227 | Tragic 13.2% |
| Lebanese | 6.6 /100 | #228 | Tragic 13.2% |
| Europeans | 6.2 /100 | #229 | Tragic 13.3% |
| Ghanaians | 6.1 /100 | #230 | Tragic 13.3% |
| Slavs | 5.3 /100 | #231 | Tragic 13.3% |
| Immigrants | Caribbean | 5.0 /100 | #232 | Tragic 13.3% |