Argentinean vs Immigrants from Denmark Single Male Poverty
COMPARE
Argentinean
Immigrants from Denmark
Single Male Poverty
Single Male Poverty Comparison
Argentineans
Immigrants from Denmark
11.9%
SINGLE MALE POVERTY
99.5/ 100
METRIC RATING
73rd/ 347
METRIC RANK
13.2%
SINGLE MALE POVERTY
8.7/ 100
METRIC RATING
225th/ 347
METRIC RANK
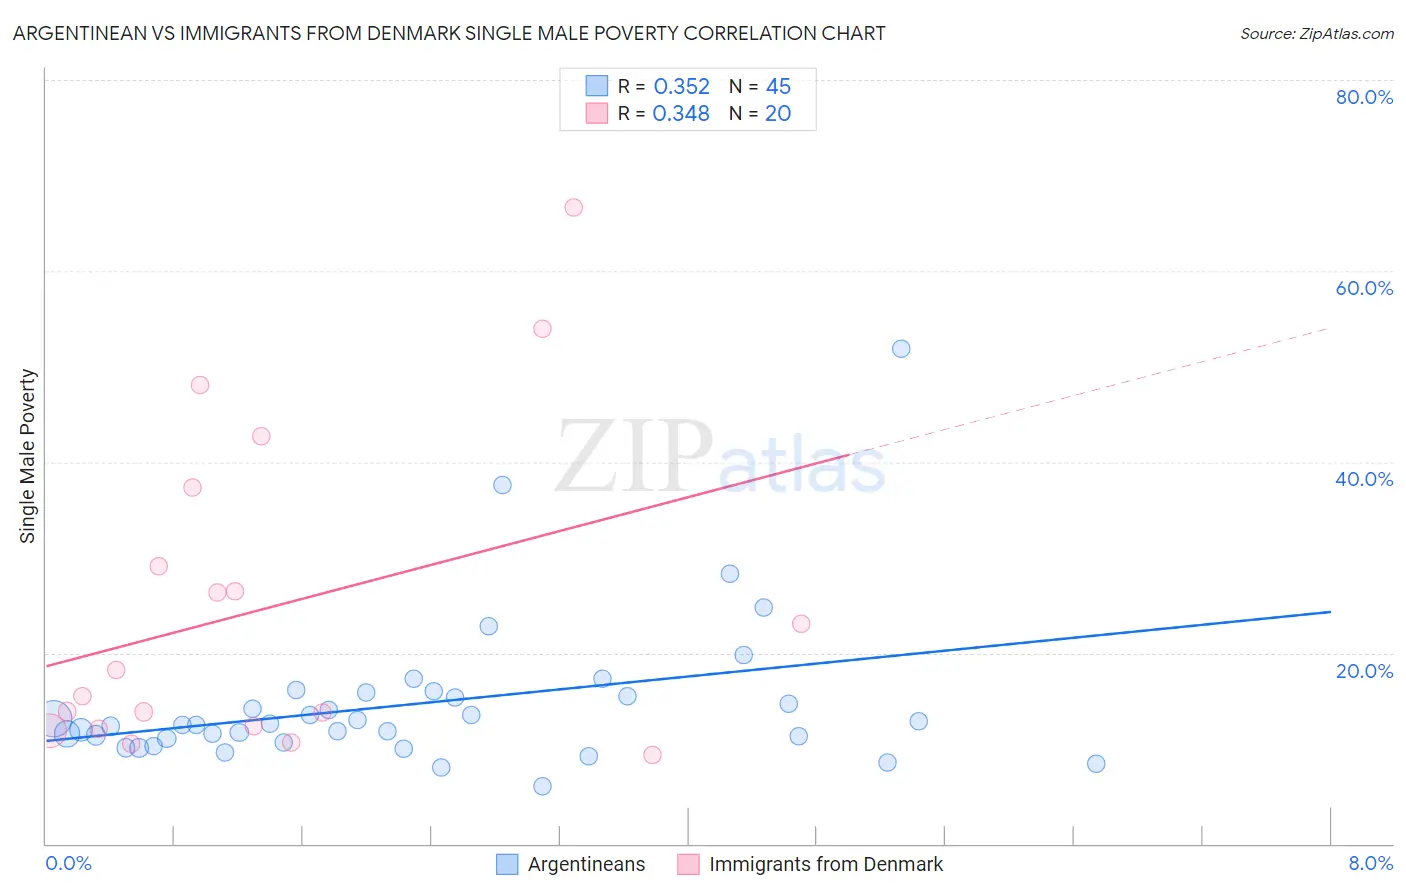
Argentinean vs Immigrants from Denmark Single Male Poverty Correlation Chart
The statistical analysis conducted on geographies consisting of 268,813,546 people shows a mild positive correlation between the proportion of Argentineans and poverty level among single males in the United States with a correlation coefficient (R) of 0.352 and weighted average of 11.9%. Similarly, the statistical analysis conducted on geographies consisting of 127,193,703 people shows a mild positive correlation between the proportion of Immigrants from Denmark and poverty level among single males in the United States with a correlation coefficient (R) of 0.348 and weighted average of 13.2%, a difference of 10.8%.
Single Male Poverty Correlation Summary
| Measurement | Argentinean | Immigrants from Denmark |
| Minimum | 6.0% | 9.3% |
| Maximum | 51.8% | 66.7% |
| Range | 45.8% | 57.4% |
| Mean | 14.7% | 24.8% |
| Median | 12.4% | 16.8% |
| Interquartile 25% (IQ1) | 10.8% | 12.2% |
| Interquartile 75% (IQ3) | 15.6% | 33.2% |
| Interquartile Range (IQR) | 4.8% | 21.1% |
| Standard Deviation (Sample) | 7.9% | 16.7% |
| Standard Deviation (Population) | 7.9% | 16.2% |
Similar Demographics by Single Male Poverty
Demographics Similar to Argentineans by Single Male Poverty
In terms of single male poverty, the demographic groups most similar to Argentineans are Chilean (11.9%, a difference of 0.060%), Immigrants from Argentina (11.9%, a difference of 0.13%), Uruguayan (11.9%, a difference of 0.25%), Immigrants from Northern Africa (11.9%, a difference of 0.27%), and Immigrants from Greece (11.9%, a difference of 0.31%).
| Demographics | Rating | Rank | Single Male Poverty |
| Immigrants | Uruguay | 99.6 /100 | #66 | Exceptional 11.9% |
| Immigrants | Ukraine | 99.6 /100 | #67 | Exceptional 11.9% |
| Immigrants | Croatia | 99.6 /100 | #68 | Exceptional 11.9% |
| Immigrants | Russia | 99.6 /100 | #69 | Exceptional 11.9% |
| Immigrants | Nepal | 99.6 /100 | #70 | Exceptional 11.9% |
| Immigrants | Greece | 99.6 /100 | #71 | Exceptional 11.9% |
| Immigrants | Argentina | 99.5 /100 | #72 | Exceptional 11.9% |
| Argentineans | 99.5 /100 | #73 | Exceptional 11.9% |
| Chileans | 99.5 /100 | #74 | Exceptional 11.9% |
| Uruguayans | 99.4 /100 | #75 | Exceptional 11.9% |
| Immigrants | Northern Africa | 99.4 /100 | #76 | Exceptional 11.9% |
| Immigrants | Malaysia | 99.2 /100 | #77 | Exceptional 12.0% |
| Immigrants | Venezuela | 99.1 /100 | #78 | Exceptional 12.0% |
| Immigrants | Belgium | 99.0 /100 | #79 | Exceptional 12.0% |
| Armenians | 98.7 /100 | #80 | Exceptional 12.1% |
Demographics Similar to Immigrants from Denmark by Single Male Poverty
In terms of single male poverty, the demographic groups most similar to Immigrants from Denmark are Somali (13.2%, a difference of 0.050%), Immigrants from the Azores (13.2%, a difference of 0.090%), Jamaican (13.2%, a difference of 0.16%), Immigrants from Western Europe (13.2%, a difference of 0.20%), and New Zealander (13.2%, a difference of 0.29%).
| Demographics | Rating | Rank | Single Male Poverty |
| Scandinavians | 12.9 /100 | #218 | Poor 13.1% |
| Immigrants | Burma/Myanmar | 12.6 /100 | #219 | Poor 13.1% |
| Central Americans | 10.9 /100 | #220 | Poor 13.2% |
| New Zealanders | 10.7 /100 | #221 | Poor 13.2% |
| Immigrants | Western Europe | 10.0 /100 | #222 | Poor 13.2% |
| Immigrants | Azores | 9.3 /100 | #223 | Tragic 13.2% |
| Somalis | 9.1 /100 | #224 | Tragic 13.2% |
| Immigrants | Denmark | 8.7 /100 | #225 | Tragic 13.2% |
| Jamaicans | 7.7 /100 | #226 | Tragic 13.2% |
| Haitians | 7.0 /100 | #227 | Tragic 13.2% |
| Lebanese | 6.6 /100 | #228 | Tragic 13.2% |
| Europeans | 6.2 /100 | #229 | Tragic 13.3% |
| Ghanaians | 6.1 /100 | #230 | Tragic 13.3% |
| Slavs | 5.3 /100 | #231 | Tragic 13.3% |
| Immigrants | Caribbean | 5.0 /100 | #232 | Tragic 13.3% |