Ottawa vs Mongolian Single Mother Poverty
COMPARE
Ottawa
Mongolian
Single Mother Poverty
Single Mother Poverty Comparison
Ottawa
Mongolians
35.5%
SINGLE MOTHER POVERTY
0.0/ 100
METRIC RATING
324th/ 347
METRIC RANK
27.7%
SINGLE MOTHER POVERTY
98.7/ 100
METRIC RATING
85th/ 347
METRIC RANK
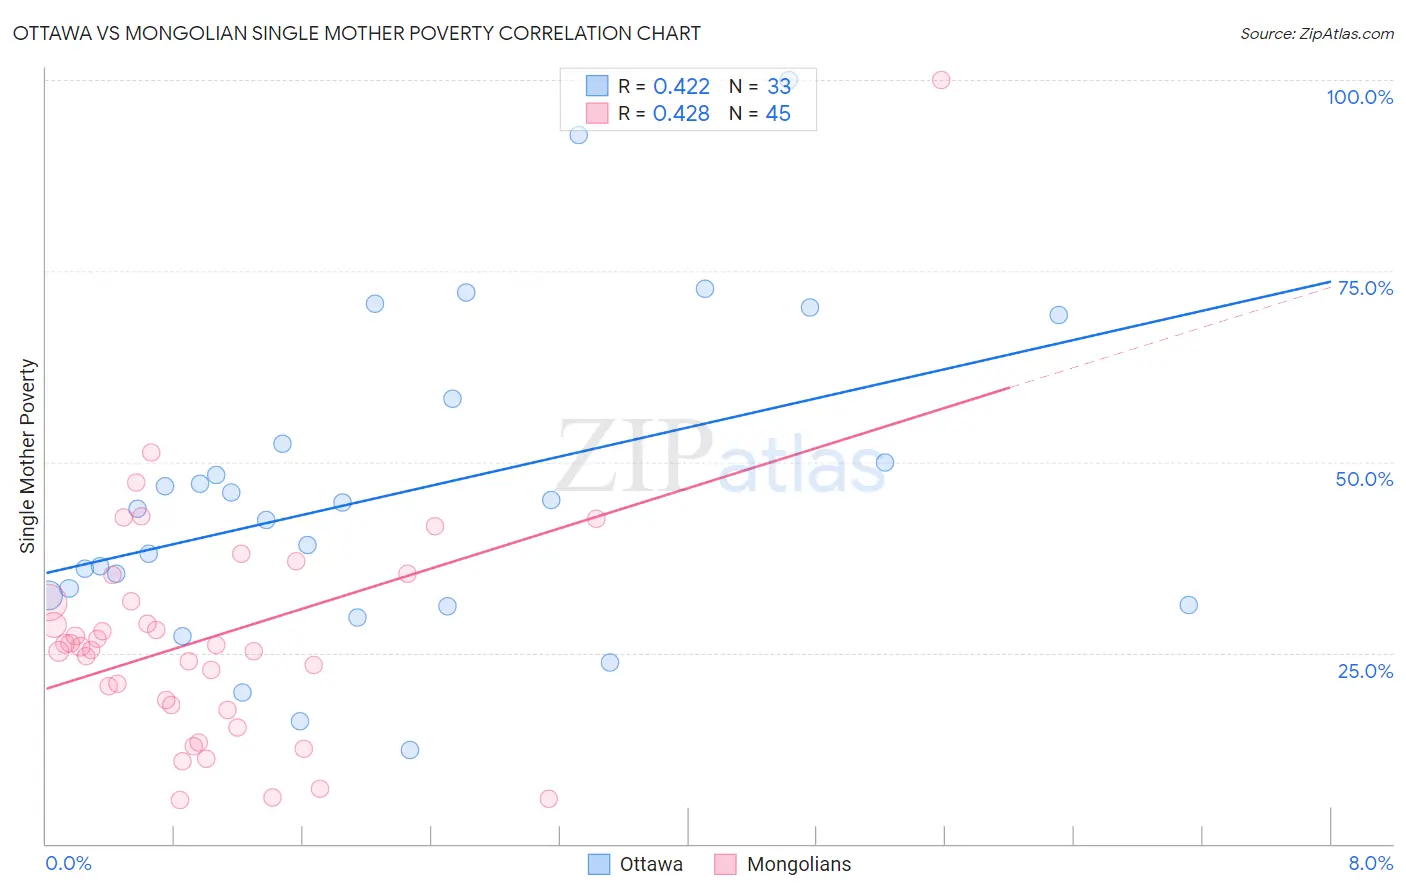
Ottawa vs Mongolian Single Mother Poverty Correlation Chart
The statistical analysis conducted on geographies consisting of 49,602,464 people shows a moderate positive correlation between the proportion of Ottawa and poverty level among single mothers in the United States with a correlation coefficient (R) of 0.422 and weighted average of 35.5%. Similarly, the statistical analysis conducted on geographies consisting of 139,079,734 people shows a moderate positive correlation between the proportion of Mongolians and poverty level among single mothers in the United States with a correlation coefficient (R) of 0.428 and weighted average of 27.7%, a difference of 28.5%.
Single Mother Poverty Correlation Summary
| Measurement | Ottawa | Mongolian |
| Minimum | 12.2% | 5.8% |
| Maximum | 100.0% | 100.0% |
| Range | 87.8% | 94.2% |
| Mean | 45.9% | 27.0% |
| Median | 43.8% | 25.8% |
| Interquartile 25% (IQ1) | 31.9% | 17.8% |
| Interquartile 75% (IQ3) | 55.3% | 33.5% |
| Interquartile Range (IQR) | 23.5% | 15.6% |
| Standard Deviation (Sample) | 20.6% | 15.8% |
| Standard Deviation (Population) | 20.3% | 15.7% |
Similar Demographics by Single Mother Poverty
Demographics Similar to Ottawa by Single Mother Poverty
In terms of single mother poverty, the demographic groups most similar to Ottawa are Kiowa (35.5%, a difference of 0.21%), Ute (35.7%, a difference of 0.48%), Seminole (35.8%, a difference of 0.78%), Black/African American (35.2%, a difference of 0.92%), and Paiute (35.1%, a difference of 1.1%).
| Demographics | Rating | Rank | Single Mother Poverty |
| Cherokee | 0.0 /100 | #317 | Tragic 34.5% |
| Immigrants | Honduras | 0.0 /100 | #318 | Tragic 34.7% |
| Chippewa | 0.0 /100 | #319 | Tragic 34.8% |
| Iroquois | 0.0 /100 | #320 | Tragic 34.8% |
| Paiute | 0.0 /100 | #321 | Tragic 35.1% |
| Blacks/African Americans | 0.0 /100 | #322 | Tragic 35.2% |
| Kiowa | 0.0 /100 | #323 | Tragic 35.5% |
| Ottawa | 0.0 /100 | #324 | Tragic 35.5% |
| Ute | 0.0 /100 | #325 | Tragic 35.7% |
| Seminole | 0.0 /100 | #326 | Tragic 35.8% |
| Yakama | 0.0 /100 | #327 | Tragic 36.4% |
| Choctaw | 0.0 /100 | #328 | Tragic 36.4% |
| Apache | 0.0 /100 | #329 | Tragic 36.6% |
| Natives/Alaskans | 0.0 /100 | #330 | Tragic 36.6% |
| Creek | 0.0 /100 | #331 | Tragic 36.7% |
Demographics Similar to Mongolians by Single Mother Poverty
In terms of single mother poverty, the demographic groups most similar to Mongolians are Immigrants from Latvia (27.7%, a difference of 0.0%), Greek (27.7%, a difference of 0.040%), Immigrants from Cameroon (27.6%, a difference of 0.090%), Immigrants from Ukraine (27.7%, a difference of 0.090%), and Afghan (27.7%, a difference of 0.19%).
| Demographics | Rating | Rank | Single Mother Poverty |
| Immigrants | North Macedonia | 99.2 /100 | #78 | Exceptional 27.5% |
| Immigrants | Italy | 99.1 /100 | #79 | Exceptional 27.5% |
| Taiwanese | 99.1 /100 | #80 | Exceptional 27.5% |
| Immigrants | Scotland | 98.9 /100 | #81 | Exceptional 27.6% |
| Immigrants | Cameroon | 98.8 /100 | #82 | Exceptional 27.6% |
| Greeks | 98.7 /100 | #83 | Exceptional 27.7% |
| Immigrants | Latvia | 98.7 /100 | #84 | Exceptional 27.7% |
| Mongolians | 98.7 /100 | #85 | Exceptional 27.7% |
| Immigrants | Ukraine | 98.6 /100 | #86 | Exceptional 27.7% |
| Afghans | 98.5 /100 | #87 | Exceptional 27.7% |
| Ethiopians | 98.4 /100 | #88 | Exceptional 27.7% |
| Immigrants | Ethiopia | 98.4 /100 | #89 | Exceptional 27.7% |
| Immigrants | France | 98.2 /100 | #90 | Exceptional 27.8% |
| Immigrants | Albania | 98.0 /100 | #91 | Exceptional 27.8% |
| Estonians | 97.9 /100 | #92 | Exceptional 27.8% |