Ottawa vs Native Hawaiian Single Mother Poverty
COMPARE
Ottawa
Native Hawaiian
Single Mother Poverty
Single Mother Poverty Comparison
Ottawa
Native Hawaiians
35.5%
SINGLE MOTHER POVERTY
0.0/ 100
METRIC RATING
324th/ 347
METRIC RANK
28.4%
SINGLE MOTHER POVERTY
88.9/ 100
METRIC RATING
136th/ 347
METRIC RANK
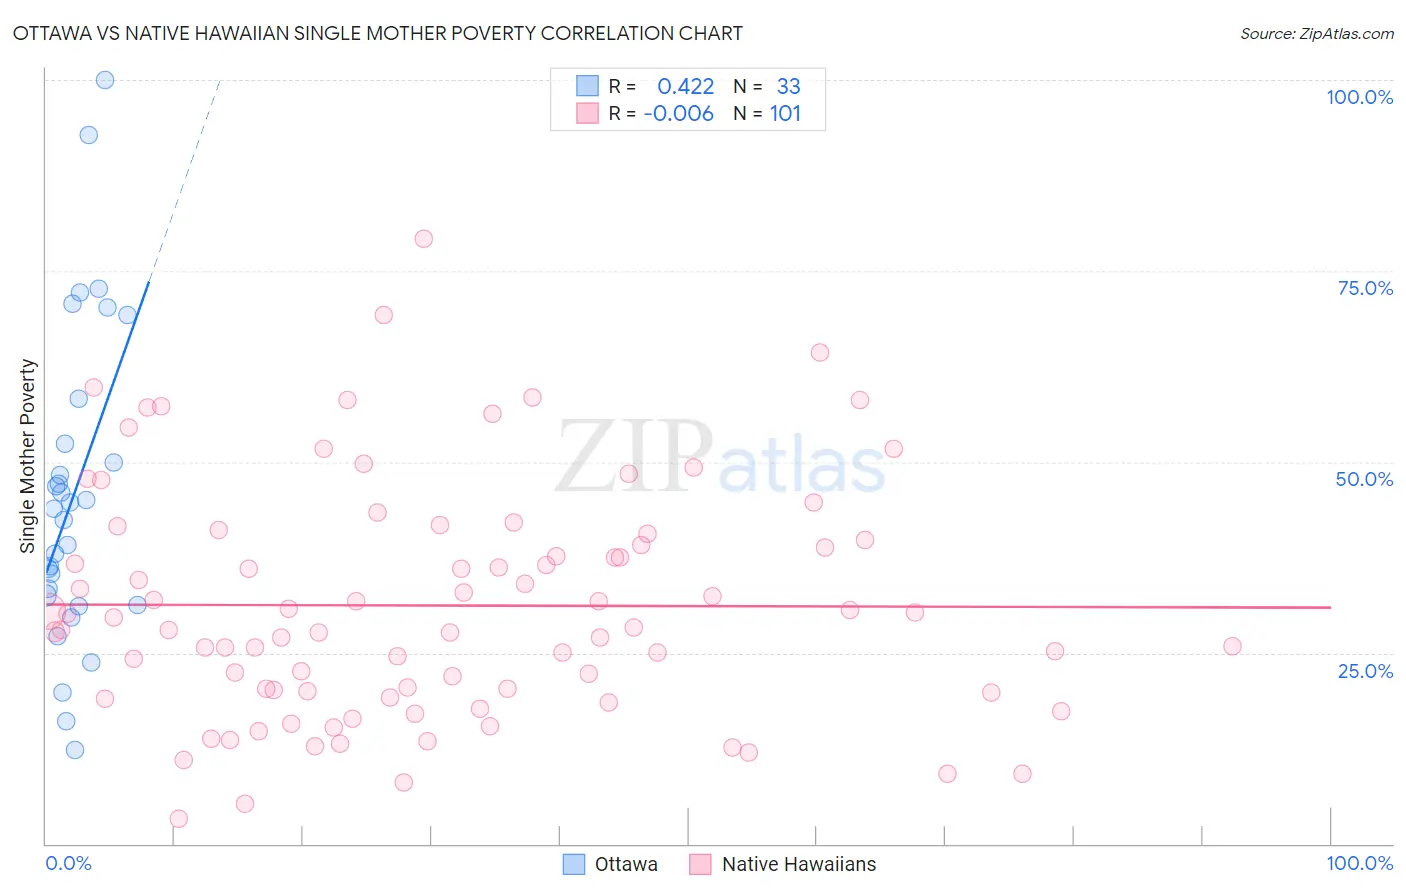
Ottawa vs Native Hawaiian Single Mother Poverty Correlation Chart
The statistical analysis conducted on geographies consisting of 49,602,464 people shows a moderate positive correlation between the proportion of Ottawa and poverty level among single mothers in the United States with a correlation coefficient (R) of 0.422 and weighted average of 35.5%. Similarly, the statistical analysis conducted on geographies consisting of 326,645,581 people shows no correlation between the proportion of Native Hawaiians and poverty level among single mothers in the United States with a correlation coefficient (R) of -0.006 and weighted average of 28.4%, a difference of 25.0%.
Single Mother Poverty Correlation Summary
| Measurement | Ottawa | Native Hawaiian |
| Minimum | 12.2% | 3.3% |
| Maximum | 100.0% | 79.2% |
| Range | 87.8% | 75.9% |
| Mean | 45.9% | 31.2% |
| Median | 43.8% | 28.4% |
| Interquartile 25% (IQ1) | 31.9% | 19.8% |
| Interquartile 75% (IQ3) | 55.3% | 40.2% |
| Interquartile Range (IQR) | 23.5% | 20.4% |
| Standard Deviation (Sample) | 20.6% | 15.3% |
| Standard Deviation (Population) | 20.3% | 15.3% |
Similar Demographics by Single Mother Poverty
Demographics Similar to Ottawa by Single Mother Poverty
In terms of single mother poverty, the demographic groups most similar to Ottawa are Kiowa (35.5%, a difference of 0.21%), Ute (35.7%, a difference of 0.48%), Seminole (35.8%, a difference of 0.78%), Black/African American (35.2%, a difference of 0.92%), and Paiute (35.1%, a difference of 1.1%).
| Demographics | Rating | Rank | Single Mother Poverty |
| Cherokee | 0.0 /100 | #317 | Tragic 34.5% |
| Immigrants | Honduras | 0.0 /100 | #318 | Tragic 34.7% |
| Chippewa | 0.0 /100 | #319 | Tragic 34.8% |
| Iroquois | 0.0 /100 | #320 | Tragic 34.8% |
| Paiute | 0.0 /100 | #321 | Tragic 35.1% |
| Blacks/African Americans | 0.0 /100 | #322 | Tragic 35.2% |
| Kiowa | 0.0 /100 | #323 | Tragic 35.5% |
| Ottawa | 0.0 /100 | #324 | Tragic 35.5% |
| Ute | 0.0 /100 | #325 | Tragic 35.7% |
| Seminole | 0.0 /100 | #326 | Tragic 35.8% |
| Yakama | 0.0 /100 | #327 | Tragic 36.4% |
| Choctaw | 0.0 /100 | #328 | Tragic 36.4% |
| Apache | 0.0 /100 | #329 | Tragic 36.6% |
| Natives/Alaskans | 0.0 /100 | #330 | Tragic 36.6% |
| Creek | 0.0 /100 | #331 | Tragic 36.7% |
Demographics Similar to Native Hawaiians by Single Mother Poverty
In terms of single mother poverty, the demographic groups most similar to Native Hawaiians are Immigrants from Canada (28.4%, a difference of 0.0%), Immigrants from Southern Europe (28.4%, a difference of 0.040%), Immigrants from Spain (28.4%, a difference of 0.040%), Immigrants from Belgium (28.5%, a difference of 0.050%), and Swedish (28.4%, a difference of 0.060%).
| Demographics | Rating | Rank | Single Mother Poverty |
| South Americans | 90.4 /100 | #129 | Exceptional 28.4% |
| Norwegians | 90.4 /100 | #130 | Exceptional 28.4% |
| Immigrants | Austria | 90.3 /100 | #131 | Exceptional 28.4% |
| Immigrants | Morocco | 89.5 /100 | #132 | Excellent 28.4% |
| Swedes | 89.4 /100 | #133 | Excellent 28.4% |
| Immigrants | Southern Europe | 89.2 /100 | #134 | Excellent 28.4% |
| Immigrants | Spain | 89.2 /100 | #135 | Excellent 28.4% |
| Native Hawaiians | 88.9 /100 | #136 | Excellent 28.4% |
| Immigrants | Canada | 88.9 /100 | #137 | Excellent 28.4% |
| Immigrants | Belgium | 88.5 /100 | #138 | Excellent 28.5% |
| Samoans | 88.1 /100 | #139 | Excellent 28.5% |
| Immigrants | Colombia | 88.0 /100 | #140 | Excellent 28.5% |
| Danes | 87.1 /100 | #141 | Excellent 28.5% |
| South Africans | 86.6 /100 | #142 | Excellent 28.5% |
| Immigrants | North America | 86.5 /100 | #143 | Excellent 28.5% |