Ottawa vs Slovak In Labor Force | Age 20-24
COMPARE
Ottawa
Slovak
In Labor Force | Age 20-24
In Labor Force | Age 20-24 Comparison
Ottawa
Slovaks
76.8%
IN LABOR FORCE | AGE 20-24
99.8/ 100
METRIC RATING
70th/ 347
METRIC RANK
77.7%
IN LABOR FORCE | AGE 20-24
100.0/ 100
METRIC RATING
29th/ 347
METRIC RANK
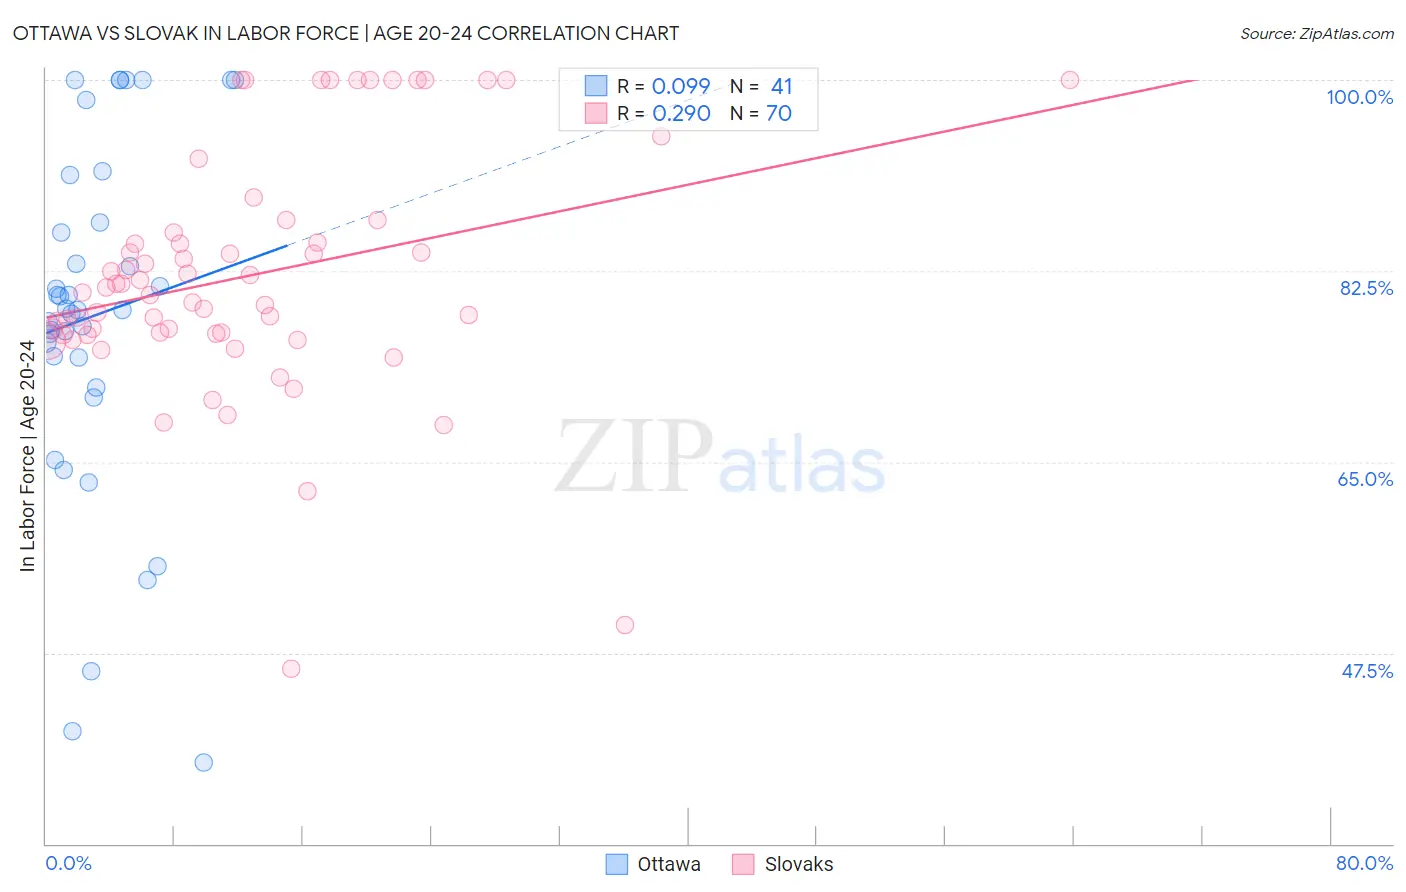
Ottawa vs Slovak In Labor Force | Age 20-24 Correlation Chart
The statistical analysis conducted on geographies consisting of 49,950,403 people shows a slight positive correlation between the proportion of Ottawa and labor force participation rate among population between the ages 20 and 24 in the United States with a correlation coefficient (R) of 0.099 and weighted average of 76.8%. Similarly, the statistical analysis conducted on geographies consisting of 397,601,730 people shows a weak positive correlation between the proportion of Slovaks and labor force participation rate among population between the ages 20 and 24 in the United States with a correlation coefficient (R) of 0.290 and weighted average of 77.7%, a difference of 1.2%.
In Labor Force | Age 20-24 Correlation Summary
| Measurement | Ottawa | Slovak |
| Minimum | 37.5% | 46.0% |
| Maximum | 100.0% | 100.0% |
| Range | 62.5% | 54.0% |
| Mean | 78.5% | 82.1% |
| Median | 78.9% | 80.8% |
| Interquartile 25% (IQ1) | 73.2% | 76.7% |
| Interquartile 75% (IQ3) | 89.1% | 86.0% |
| Interquartile Range (IQR) | 15.9% | 9.3% |
| Standard Deviation (Sample) | 16.0% | 11.1% |
| Standard Deviation (Population) | 15.8% | 11.0% |
Similar Demographics by In Labor Force | Age 20-24
Demographics Similar to Ottawa by In Labor Force | Age 20-24
In terms of in labor force | age 20-24, the demographic groups most similar to Ottawa are Immigrants from Sudan (76.8%, a difference of 0.010%), French American Indian (76.8%, a difference of 0.030%), Slavic (76.9%, a difference of 0.060%), Icelander (76.9%, a difference of 0.070%), and Northern European (76.8%, a difference of 0.070%).
| Demographics | Rating | Rank | In Labor Force | Age 20-24 |
| Lithuanians | 99.9 /100 | #63 | Exceptional 77.0% |
| Whites/Caucasians | 99.9 /100 | #64 | Exceptional 76.9% |
| Crow | 99.9 /100 | #65 | Exceptional 76.9% |
| Icelanders | 99.9 /100 | #66 | Exceptional 76.9% |
| Slavs | 99.9 /100 | #67 | Exceptional 76.9% |
| French American Indians | 99.8 /100 | #68 | Exceptional 76.8% |
| Immigrants | Sudan | 99.8 /100 | #69 | Exceptional 76.8% |
| Ottawa | 99.8 /100 | #70 | Exceptional 76.8% |
| Northern Europeans | 99.8 /100 | #71 | Exceptional 76.8% |
| Guamanians/Chamorros | 99.8 /100 | #72 | Exceptional 76.7% |
| British | 99.8 /100 | #73 | Exceptional 76.7% |
| Cree | 99.7 /100 | #74 | Exceptional 76.6% |
| Immigrants | Middle Africa | 99.7 /100 | #75 | Exceptional 76.6% |
| Immigrants | Moldova | 99.6 /100 | #76 | Exceptional 76.6% |
| Immigrants | Cameroon | 99.6 /100 | #77 | Exceptional 76.6% |
Demographics Similar to Slovaks by In Labor Force | Age 20-24
In terms of in labor force | age 20-24, the demographic groups most similar to Slovaks are Swiss (77.7%, a difference of 0.020%), Belgian (77.8%, a difference of 0.090%), Immigrants from Micronesia (77.8%, a difference of 0.12%), Polish (77.6%, a difference of 0.14%), and English (77.6%, a difference of 0.20%).
| Demographics | Rating | Rank | In Labor Force | Age 20-24 |
| Pennsylvania Germans | 100.0 /100 | #22 | Exceptional 78.0% |
| Yugoslavians | 100.0 /100 | #23 | Exceptional 78.0% |
| Liberians | 100.0 /100 | #24 | Exceptional 78.0% |
| Tlingit-Haida | 100.0 /100 | #25 | Exceptional 77.9% |
| Tongans | 100.0 /100 | #26 | Exceptional 77.9% |
| Immigrants | Micronesia | 100.0 /100 | #27 | Exceptional 77.8% |
| Belgians | 100.0 /100 | #28 | Exceptional 77.8% |
| Slovaks | 100.0 /100 | #29 | Exceptional 77.7% |
| Swiss | 100.0 /100 | #30 | Exceptional 77.7% |
| Poles | 100.0 /100 | #31 | Exceptional 77.6% |
| English | 100.0 /100 | #32 | Exceptional 77.6% |
| Immigrants | Ethiopia | 100.0 /100 | #33 | Exceptional 77.5% |
| German Russians | 100.0 /100 | #34 | Exceptional 77.5% |
| Immigrants | Eastern Africa | 100.0 /100 | #35 | Exceptional 77.5% |
| Welsh | 100.0 /100 | #36 | Exceptional 77.5% |