Ottawa vs Immigrants from Uganda Associate's Degree

COMPARE

Ottawa
Race
Ancestry
AfghanAfricanAlaska NativeAlaskan AthabascanAlbanianAleutAlsatianAmericanApacheArabArapahoArgentineanArmenianAssyrian/Chaldean/SyriacAustralianAustrianBahamianBangladeshiBarbadianBasqueBelgianBelizeanBermudanBhutaneseBlackfeetBolivianBrazilianBritishBritish West IndianBulgarianBurmeseCajunCambodianCanadianCape VerdeanCarpatho RusynCelticCentral AmericanCentral American IndianCherokeeCheyenneChickasawChileanChineseChippewaChoctawColombianColvilleComancheCosta RicanCreeCreekCroatianCrowCubanCypriotCzechCzechoslovakianDanishDelawareDominicanDutchDutch West IndianEastern EuropeanEcuadorianEgyptianEnglishEstonianEthiopianEuropeanFijianFilipinoFinnishFrenchFrench American IndianFrench CanadianGermanGerman RussianGhanaianGreekGuamanian/ChamorroGuatemalanGuyaneseHaitianHmongHonduranHopiHoumaHungarianIcelanderIndian (Asian)IndonesianInupiatIranianIraqiIrishIroquoisIsraeliItalianJamaicanJapaneseJordanianKenyanKiowaKoreanLaotianLatvianLebaneseLiberianLithuanianLumbeeLuxembourgerMacedonianMalaysianMalteseMarshalleseMenomineeMexicanMexican American IndianMongolianMoroccanNative HawaiianNavajoNepaleseNew ZealanderNicaraguanNigerianNorthern EuropeanNorwegianOkinawanOsageOttawaPaiutePakistaniPalestinianPanamanianParaguayanPennsylvania GermanPeruvianPimaPolishPortuguesePotawatomiPuebloPuerto RicanPuget Sound SalishRomanianRussianSalvadoranSamoanScandinavianScotch-IrishScottishSeminoleSenegaleseSerbianShoshoneSierra LeoneanSiouxSlavicSlovakSloveneSomaliSouth AfricanSouth AmericanSouth American IndianSoviet UnionSpaniardSpanishSpanish AmericanSpanish American IndianSri LankanSubsaharan AfricanSudaneseSwedishSwissSyrianTaiwaneseThaiTlingit-HaidaTohono O'OdhamTonganTrinidadian and TobagonianTsimshianTurkishU.S. Virgin IslanderUgandanUkrainianUruguayanUteVenezuelanVietnameseWelshWest IndianYakamaYaquiYugoslavianYumanYup'ikZimbabwean
Immigration
NonimmigrantsImmigrantsAfghanistanAfricaAlbaniaArgentinaArmeniaAsiaAustraliaAustriaBahamasBangladeshBarbadosBelarusBelgiumBelizeBoliviaBosnia and HerzegovinaBrazilBulgariaBurma/MyanmarCabo VerdeCambodiaCameroonCanadaCaribbeanCentral AmericaChileChinaColombiaCongoCosta RicaCroatiaCubaCzechoslovakiaDenmarkDominicaDominican RepublicEastern AfricaEastern AsiaEastern EuropeEcuadorEgyptEl SalvadorEnglandEritreaEthiopiaEuropeFijiFranceGermanyGhanaGreeceGrenadaGuatemalaGuyanaHaitiHondurasHong KongHungaryIndiaIndonesiaIranIraqIrelandIsraelItalyJamaicaJapanJordanKazakhstanKenyaKoreaKuwaitLaosLatin AmericaLatviaLebanonLiberiaLithuaniaMalaysiaMexicoMicronesiaMiddle AfricaMoldovaMoroccoNepalNetherlandsNicaraguaNigeriaNorth AmericaNorth MacedoniaNorthern AfricaNorthern EuropeNorwayOceaniaPakistanPanamaPeruPhilippinesPolandPortugalRomaniaRussiaSaudi ArabiaScotlandSenegalSerbiaSierra LeoneSingaporeSomaliaSouth AfricaSouth AmericaSouth Central AsiaSouth Eastern AsiaSouthern EuropeSpainSri LankaSt. Vincent and the GrenadinesSudanSwedenSwitzerlandSyriaTaiwanThailandTrinidad and TobagoTurkeyUkraineUruguayUzbekistanVenezuelaVietnamWest IndiesWestern AfricaWestern AsiaWestern EuropeYemenZaireZimbabweAzores
Immigrants from Uganda
Race
Ancestry
AfghanAfricanAlaska NativeAlaskan AthabascanAlbanianAleutAlsatianAmericanApacheArabArapahoArgentineanArmenianAssyrian/Chaldean/SyriacAustralianAustrianBahamianBangladeshiBarbadianBasqueBelgianBelizeanBermudanBhutaneseBlackfeetBolivianBrazilianBritishBritish West IndianBulgarianBurmeseCajunCambodianCanadianCape VerdeanCarpatho RusynCelticCentral AmericanCentral American IndianCherokeeCheyenneChickasawChileanChineseChippewaChoctawColombianColvilleComancheCosta RicanCreeCreekCroatianCrowCubanCypriotCzechCzechoslovakianDanishDelawareDominicanDutchDutch West IndianEastern EuropeanEcuadorianEgyptianEnglishEstonianEthiopianEuropeanFijianFilipinoFinnishFrenchFrench American IndianFrench CanadianGermanGerman RussianGhanaianGreekGuamanian/ChamorroGuatemalanGuyaneseHaitianHmongHonduranHopiHoumaHungarianIcelanderIndian (Asian)IndonesianInupiatIranianIraqiIrishIroquoisIsraeliItalianJamaicanJapaneseJordanianKenyanKiowaKoreanLaotianLatvianLebaneseLiberianLithuanianLumbeeLuxembourgerMacedonianMalaysianMalteseMarshalleseMenomineeMexicanMexican American IndianMongolianMoroccanNative HawaiianNavajoNepaleseNew ZealanderNicaraguanNigerianNorthern EuropeanNorwegianOkinawanOsagePaiutePakistaniPalestinianPanamanianParaguayanPennsylvania GermanPeruvianPimaPolishPortuguesePotawatomiPuebloPuerto RicanPuget Sound SalishRomanianRussianSalvadoranSamoanScandinavianScotch-IrishScottishSeminoleSenegaleseSerbianShoshoneSierra LeoneanSiouxSlavicSlovakSloveneSomaliSouth AfricanSouth AmericanSouth American IndianSoviet UnionSpaniardSpanishSpanish AmericanSpanish American IndianSri LankanSubsaharan AfricanSudaneseSwedishSwissSyrianTaiwaneseThaiTlingit-HaidaTohono O'OdhamTonganTrinidadian and TobagonianTsimshianTurkishU.S. Virgin IslanderUgandanUkrainianUruguayanUteVenezuelanVietnameseWelshWest IndianYakamaYaquiYugoslavianYumanYup'ikZimbabwean
Immigration
NonimmigrantsImmigrantsAfghanistanAfricaAlbaniaArgentinaArmeniaAsiaAustraliaAustriaBahamasBangladeshBarbadosBelarusBelgiumBelizeBoliviaBosnia and HerzegovinaBrazilBulgariaBurma/MyanmarCabo VerdeCambodiaCameroonCanadaCaribbeanCentral AmericaChileChinaColombiaCongoCosta RicaCroatiaCubaCzechoslovakiaDenmarkDominicaDominican RepublicEastern AfricaEastern AsiaEastern EuropeEcuadorEgyptEl SalvadorEnglandEritreaEthiopiaEuropeFijiFranceGermanyGhanaGreeceGrenadaGuatemalaGuyanaHaitiHondurasHong KongHungaryIndiaIndonesiaIranIraqIrelandIsraelItalyJamaicaJapanJordanKazakhstanKenyaKoreaKuwaitLaosLatin AmericaLatviaLebanonLiberiaLithuaniaMalaysiaMexicoMicronesiaMiddle AfricaMoldovaMoroccoNepalNetherlandsNicaraguaNigeriaNorth AmericaNorth MacedoniaNorthern AfricaNorthern EuropeNorwayOceaniaPakistanPanamaPeruPhilippinesPolandPortugalRomaniaRussiaSaudi ArabiaScotlandSenegalSerbiaSierra LeoneSingaporeSomaliaSouth AfricaSouth AmericaSouth Central AsiaSouth Eastern AsiaSouthern EuropeSpainSri LankaSt. Vincent and the GrenadinesSudanSwedenSwitzerlandSyriaTaiwanThailandTrinidad and TobagoTurkeyUgandaUkraineUruguayUzbekistanVenezuelaVietnamWest IndiesWestern AfricaWestern AsiaWestern EuropeYemenZaireZimbabweAzores
Associate's Degree
Income
Poverty
Unemployment
Labor Participation
Family Structure
Vehicle Availability
Education Level
Disability

Associate's Degree Comparison

Ottawa

Immigrants from Uganda

Tragic
Exceptional
40.3%
ASSOCIATE'S DEGREE
0.1/ 100
METRIC RATING
278th/ 347
METRIC RANK
48.5%
ASSOCIATE'S DEGREE
92.1/ 100
METRIC RATING
127th/ 347
METRIC RANK

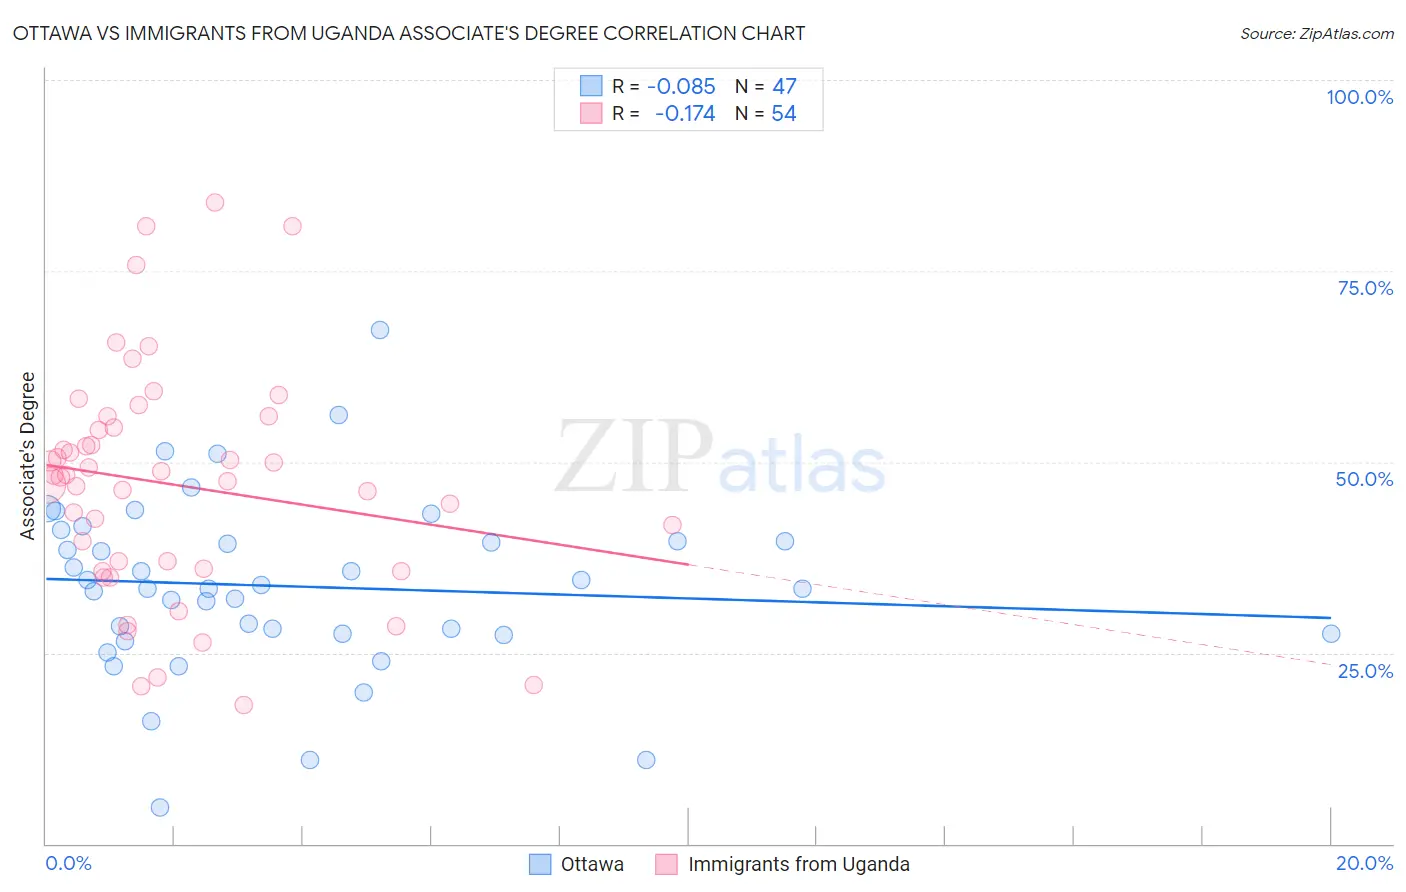
Ottawa vs Immigrants from Uganda Associate's Degree Correlation Chart

The statistical analysis conducted on geographies consisting of 49,956,602 people shows a slight negative correlation between the proportion of Ottawa and percentage of population with at least associate's degree education in the United States with a correlation coefficient (R) of -0.085 and weighted average of 40.3%. Similarly, the statistical analysis conducted on geographies consisting of 125,982,535 people shows a poor negative correlation between the proportion of Immigrants from Uganda and percentage of population with at least associate's degree education in the United States with a correlation coefficient (R) of -0.174 and weighted average of 48.5%, a difference of 20.4%.
Ottawa vs Immigrants from Uganda Associate's Degree

Associate's Degree Correlation Summary

MeasurementOttawaImmigrants from Uganda
Minimum4.8%18.1%
Maximum67.2%84.0%
Range62.4%65.9%
Mean33.7%47.0%
Median33.5%48.2%
Interquartile 25% (IQ1)27.5%36.0%
Interquartile 75% (IQ3)39.7%54.5%
Interquartile Range (IQR)12.2%18.5%
Standard Deviation (Sample)11.6%15.0%
Standard Deviation (Population)11.5%14.9%

Similar Demographics by Associate's Degree

Demographics Similar to Ottawa by Associate's Degree

In terms of associate's degree, the demographic groups most similar to Ottawa are Immigrants from Nicaragua (40.3%, a difference of 0.040%), Blackfeet (40.3%, a difference of 0.15%), Puerto Rican (40.4%, a difference of 0.20%), Immigrants from Micronesia (40.2%, a difference of 0.24%), and Potawatomi (40.4%, a difference of 0.30%).
DemographicsRating | RankAssociate's Degree
Immigrants | Laos
0.1
/100
|
#271
Tragic
40.7%
Belizeans
0.1
/100
|
#272
Tragic
40.6%
Puget Sound Salish
0.1
/100
|
#273
Tragic
40.5%
Immigrants | Dominica
0.1
/100
|
#274
Tragic
40.5%
Potawatomi
0.1
/100
|
#275
Tragic
40.4%
Puerto Ricans
0.1
/100
|
#276
Tragic
40.4%
Blackfeet
0.1
/100
|
#277
Tragic
40.3%
Ottawa
0.1
/100
|
#278
Tragic
40.3%
Immigrants | Nicaragua
0.1
/100
|
#279
Tragic
40.3%
Immigrants | Micronesia
0.1
/100
|
#280
Tragic
40.2%
Immigrants | Portugal
0.1
/100
|
#281
Tragic
40.1%
Bangladeshis
0.1
/100
|
#282
Tragic
40.0%
Haitians
0.1
/100
|
#283
Tragic
40.0%
Comanche
0.1
/100
|
#284
Tragic
39.9%
Immigrants | Belize
0.1
/100
|
#285
Tragic
39.9%

Demographics Similar to Immigrants from Uganda by Associate's Degree

In terms of associate's degree, the demographic groups most similar to Immigrants from Uganda are Immigrants from Syria (48.5%, a difference of 0.010%), Chinese (48.5%, a difference of 0.10%), Serbian (48.5%, a difference of 0.12%), Immigrants from Eastern Africa (48.4%, a difference of 0.12%), and Swedish (48.4%, a difference of 0.15%).
DemographicsRating | RankAssociate's Degree
Alsatians
94.6
/100
|
#120
Exceptional
48.8%
Ugandans
93.9
/100
|
#121
Exceptional
48.7%
Italians
93.9
/100
|
#122
Exceptional
48.7%
Brazilians
93.7
/100
|
#123
Exceptional
48.7%
Serbians
92.6
/100
|
#124
Exceptional
48.5%
Chinese
92.5
/100
|
#125
Exceptional
48.5%
Immigrants | Syria
92.2
/100
|
#126
Exceptional
48.5%
Immigrants | Uganda
92.1
/100
|
#127
Exceptional
48.5%
Immigrants | Eastern Africa
91.6
/100
|
#128
Exceptional
48.4%
Swedes
91.5
/100
|
#129
Exceptional
48.4%
Immigrants | Jordan
91.2
/100
|
#130
Exceptional
48.4%
Icelanders
90.8
/100
|
#131
Exceptional
48.3%
Immigrants | Albania
89.9
/100
|
#132
Excellent
48.2%
Assyrians/Chaldeans/Syriacs
89.4
/100
|
#133
Excellent
48.2%
Moroccans
89.3
/100
|
#134
Excellent
48.2%