Osage vs South African Single Father Poverty
COMPARE
Osage
South African
Single Father Poverty
Single Father Poverty Comparison
Osage
South Africans
19.0%
SINGLE FATHER POVERTY
0.0/ 100
METRIC RATING
316th/ 347
METRIC RANK
16.1%
SINGLE FATHER POVERTY
75.1/ 100
METRIC RATING
149th/ 347
METRIC RANK
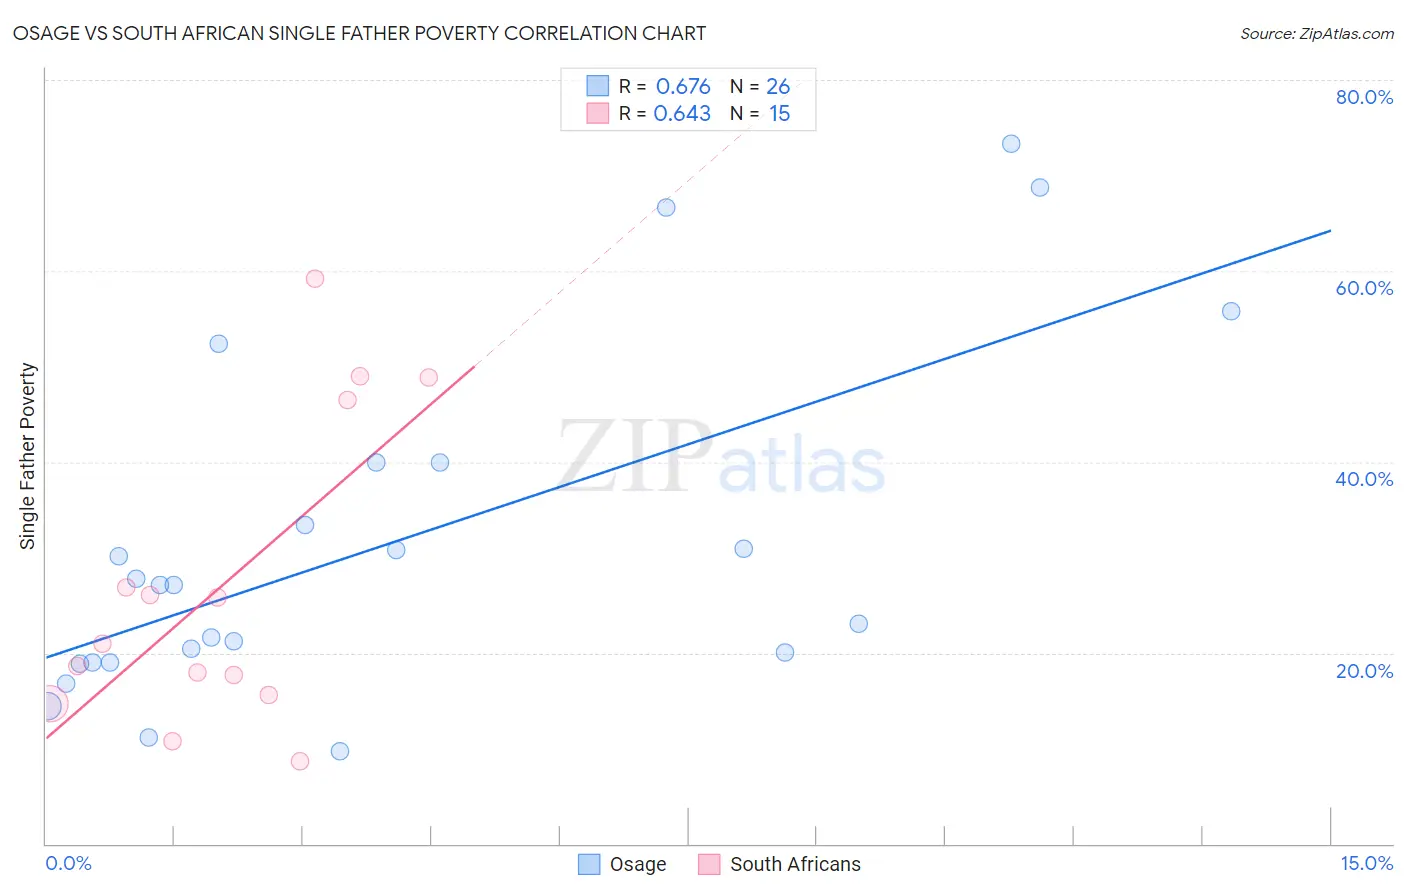
Osage vs South African Single Father Poverty Correlation Chart
The statistical analysis conducted on geographies consisting of 82,975,637 people shows a significant positive correlation between the proportion of Osage and poverty level among single fathers in the United States with a correlation coefficient (R) of 0.676 and weighted average of 19.0%. Similarly, the statistical analysis conducted on geographies consisting of 151,650,915 people shows a significant positive correlation between the proportion of South Africans and poverty level among single fathers in the United States with a correlation coefficient (R) of 0.643 and weighted average of 16.1%, a difference of 18.2%.
Single Father Poverty Correlation Summary
| Measurement | Osage | South African |
| Minimum | 9.7% | 8.7% |
| Maximum | 73.3% | 59.2% |
| Range | 63.7% | 50.5% |
| Mean | 31.5% | 27.1% |
| Median | 27.1% | 20.9% |
| Interquartile 25% (IQ1) | 19.0% | 15.6% |
| Interquartile 75% (IQ3) | 40.0% | 46.4% |
| Interquartile Range (IQR) | 21.0% | 30.8% |
| Standard Deviation (Sample) | 17.9% | 15.9% |
| Standard Deviation (Population) | 17.5% | 15.3% |
Similar Demographics by Single Father Poverty
Demographics Similar to Osage by Single Father Poverty
In terms of single father poverty, the demographic groups most similar to Osage are Dominican (19.1%, a difference of 0.31%), Chickasaw (19.0%, a difference of 0.40%), Delaware (18.9%, a difference of 0.56%), Potawatomi (18.9%, a difference of 0.72%), and Dutch West Indian (19.2%, a difference of 0.89%).
| Demographics | Rating | Rank | Single Father Poverty |
| Immigrants | Micronesia | 0.0 /100 | #309 | Tragic 18.6% |
| Chippewa | 0.0 /100 | #310 | Tragic 18.8% |
| Immigrants | Nonimmigrants | 0.0 /100 | #311 | Tragic 18.8% |
| Immigrants | Dominica | 0.0 /100 | #312 | Tragic 18.9% |
| Potawatomi | 0.0 /100 | #313 | Tragic 18.9% |
| Delaware | 0.0 /100 | #314 | Tragic 18.9% |
| Chickasaw | 0.0 /100 | #315 | Tragic 19.0% |
| Osage | 0.0 /100 | #316 | Tragic 19.0% |
| Dominicans | 0.0 /100 | #317 | Tragic 19.1% |
| Dutch West Indians | 0.0 /100 | #318 | Tragic 19.2% |
| Slovaks | 0.0 /100 | #319 | Tragic 19.3% |
| Inupiat | 0.0 /100 | #320 | Tragic 19.5% |
| Cherokee | 0.0 /100 | #321 | Tragic 19.6% |
| Creek | 0.0 /100 | #322 | Tragic 19.8% |
| Pennsylvania Germans | 0.0 /100 | #323 | Tragic 20.0% |
Demographics Similar to South Africans by Single Father Poverty
In terms of single father poverty, the demographic groups most similar to South Africans are Jordanian (16.1%, a difference of 0.060%), Nigerian (16.1%, a difference of 0.10%), Colombian (16.1%, a difference of 0.12%), Immigrants from France (16.1%, a difference of 0.12%), and Immigrants from Zimbabwe (16.1%, a difference of 0.18%).
| Demographics | Rating | Rank | Single Father Poverty |
| Immigrants | Mexico | 83.3 /100 | #142 | Excellent 16.0% |
| Immigrants | Central America | 83.1 /100 | #143 | Excellent 16.0% |
| Immigrants | Kuwait | 81.4 /100 | #144 | Excellent 16.0% |
| Immigrants | Western Asia | 80.7 /100 | #145 | Excellent 16.0% |
| Immigrants | Hungary | 78.3 /100 | #146 | Good 16.1% |
| Colombians | 77.1 /100 | #147 | Good 16.1% |
| Nigerians | 76.8 /100 | #148 | Good 16.1% |
| South Africans | 75.1 /100 | #149 | Good 16.1% |
| Jordanians | 74.2 /100 | #150 | Good 16.1% |
| Immigrants | France | 73.1 /100 | #151 | Good 16.1% |
| Immigrants | Zimbabwe | 72.1 /100 | #152 | Good 16.1% |
| Immigrants | Israel | 72.0 /100 | #153 | Good 16.1% |
| Mexicans | 70.1 /100 | #154 | Good 16.1% |
| Immigrants | Nicaragua | 67.8 /100 | #155 | Good 16.2% |
| Immigrants | Jordan | 66.0 /100 | #156 | Good 16.2% |