Luxembourger vs South African Single Father Poverty
COMPARE
Luxembourger
South African
Single Father Poverty
Single Father Poverty Comparison
Luxembourgers
South Africans
17.1%
SINGLE FATHER POVERTY
1.1/ 100
METRIC RATING
251st/ 347
METRIC RANK
16.1%
SINGLE FATHER POVERTY
75.1/ 100
METRIC RATING
149th/ 347
METRIC RANK
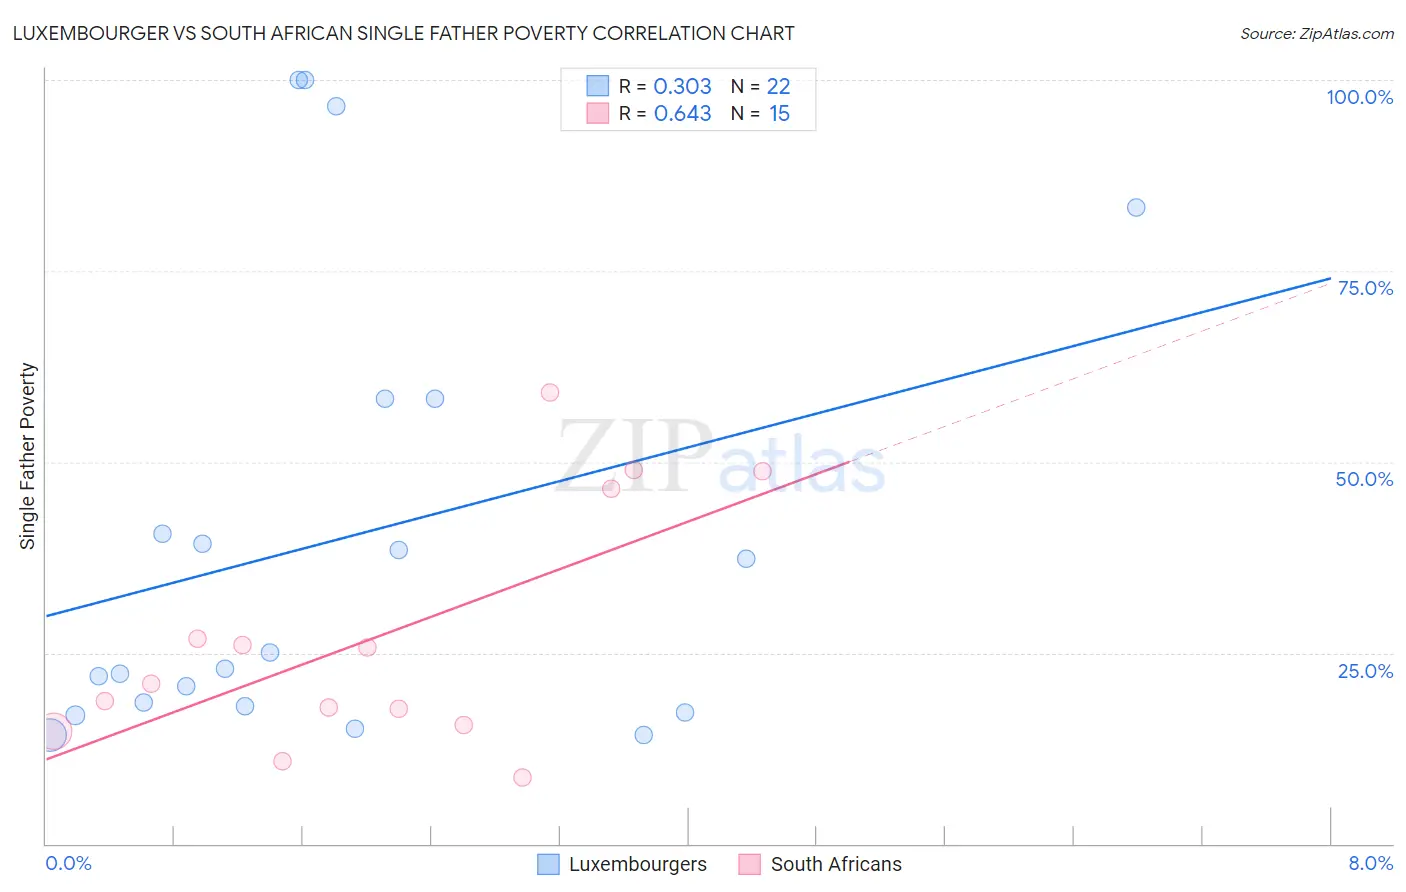
Luxembourger vs South African Single Father Poverty Correlation Chart
The statistical analysis conducted on geographies consisting of 123,209,888 people shows a mild positive correlation between the proportion of Luxembourgers and poverty level among single fathers in the United States with a correlation coefficient (R) of 0.303 and weighted average of 17.1%. Similarly, the statistical analysis conducted on geographies consisting of 151,650,915 people shows a significant positive correlation between the proportion of South Africans and poverty level among single fathers in the United States with a correlation coefficient (R) of 0.643 and weighted average of 16.1%, a difference of 6.3%.
Single Father Poverty Correlation Summary
| Measurement | Luxembourger | South African |
| Minimum | 14.2% | 8.7% |
| Maximum | 100.0% | 59.2% |
| Range | 85.8% | 50.5% |
| Mean | 40.0% | 27.1% |
| Median | 24.0% | 20.9% |
| Interquartile 25% (IQ1) | 18.0% | 15.6% |
| Interquartile 75% (IQ3) | 58.3% | 46.4% |
| Interquartile Range (IQR) | 40.4% | 30.8% |
| Standard Deviation (Sample) | 29.6% | 15.9% |
| Standard Deviation (Population) | 29.0% | 15.3% |
Similar Demographics by Single Father Poverty
Demographics Similar to Luxembourgers by Single Father Poverty
In terms of single father poverty, the demographic groups most similar to Luxembourgers are Austrian (17.1%, a difference of 0.010%), Croatian (17.1%, a difference of 0.10%), Cree (17.1%, a difference of 0.11%), Canadian (17.1%, a difference of 0.14%), and Greek (17.1%, a difference of 0.18%).
| Demographics | Rating | Rank | Single Father Poverty |
| Hondurans | 1.6 /100 | #244 | Tragic 17.0% |
| Trinidadians and Tobagonians | 1.5 /100 | #245 | Tragic 17.0% |
| Immigrants | Ireland | 1.4 /100 | #246 | Tragic 17.1% |
| Greeks | 1.3 /100 | #247 | Tragic 17.1% |
| Czechoslovakians | 1.3 /100 | #248 | Tragic 17.1% |
| Canadians | 1.3 /100 | #249 | Tragic 17.1% |
| Austrians | 1.1 /100 | #250 | Tragic 17.1% |
| Luxembourgers | 1.1 /100 | #251 | Tragic 17.1% |
| Croatians | 1.0 /100 | #252 | Tragic 17.1% |
| Cree | 1.0 /100 | #253 | Tragic 17.1% |
| Immigrants | Honduras | 0.9 /100 | #254 | Tragic 17.1% |
| Sierra Leoneans | 0.8 /100 | #255 | Tragic 17.2% |
| Immigrants | Haiti | 0.8 /100 | #256 | Tragic 17.2% |
| Immigrants | Albania | 0.7 /100 | #257 | Tragic 17.2% |
| Albanians | 0.7 /100 | #258 | Tragic 17.2% |
Demographics Similar to South Africans by Single Father Poverty
In terms of single father poverty, the demographic groups most similar to South Africans are Jordanian (16.1%, a difference of 0.060%), Nigerian (16.1%, a difference of 0.10%), Colombian (16.1%, a difference of 0.12%), Immigrants from France (16.1%, a difference of 0.12%), and Immigrants from Zimbabwe (16.1%, a difference of 0.18%).
| Demographics | Rating | Rank | Single Father Poverty |
| Immigrants | Mexico | 83.3 /100 | #142 | Excellent 16.0% |
| Immigrants | Central America | 83.1 /100 | #143 | Excellent 16.0% |
| Immigrants | Kuwait | 81.4 /100 | #144 | Excellent 16.0% |
| Immigrants | Western Asia | 80.7 /100 | #145 | Excellent 16.0% |
| Immigrants | Hungary | 78.3 /100 | #146 | Good 16.1% |
| Colombians | 77.1 /100 | #147 | Good 16.1% |
| Nigerians | 76.8 /100 | #148 | Good 16.1% |
| South Africans | 75.1 /100 | #149 | Good 16.1% |
| Jordanians | 74.2 /100 | #150 | Good 16.1% |
| Immigrants | France | 73.1 /100 | #151 | Good 16.1% |
| Immigrants | Zimbabwe | 72.1 /100 | #152 | Good 16.1% |
| Immigrants | Israel | 72.0 /100 | #153 | Good 16.1% |
| Mexicans | 70.1 /100 | #154 | Good 16.1% |
| Immigrants | Nicaragua | 67.8 /100 | #155 | Good 16.2% |
| Immigrants | Jordan | 66.0 /100 | #156 | Good 16.2% |