Sierra Leonean vs South African Single Father Poverty
COMPARE
Sierra Leonean
South African
Single Father Poverty
Single Father Poverty Comparison
Sierra Leoneans
South Africans
17.2%
SINGLE FATHER POVERTY
0.8/ 100
METRIC RATING
255th/ 347
METRIC RANK
16.1%
SINGLE FATHER POVERTY
75.1/ 100
METRIC RATING
149th/ 347
METRIC RANK
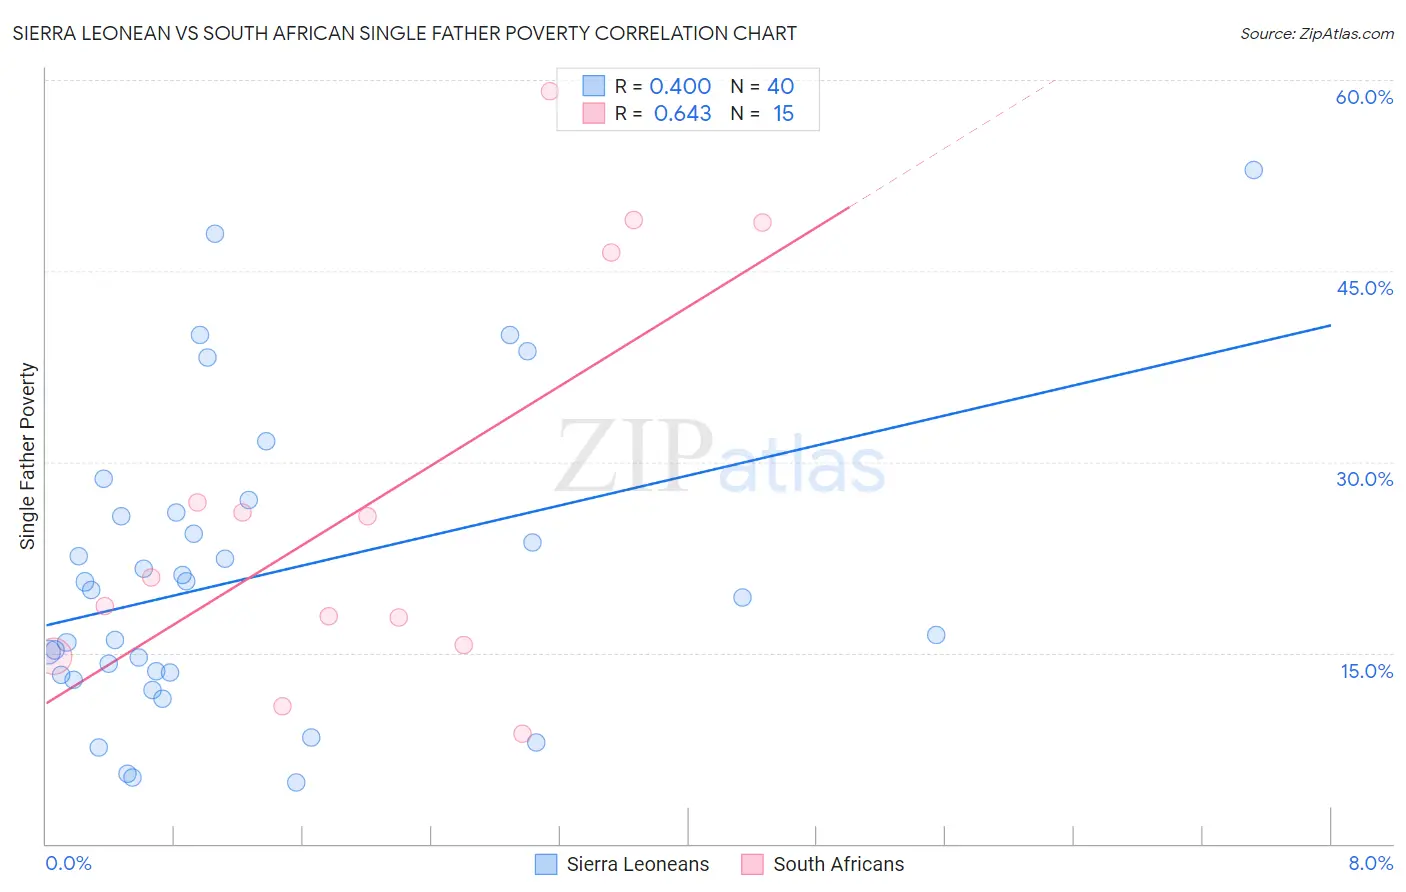
Sierra Leonean vs South African Single Father Poverty Correlation Chart
The statistical analysis conducted on geographies consisting of 77,262,166 people shows a mild positive correlation between the proportion of Sierra Leoneans and poverty level among single fathers in the United States with a correlation coefficient (R) of 0.400 and weighted average of 17.2%. Similarly, the statistical analysis conducted on geographies consisting of 151,650,915 people shows a significant positive correlation between the proportion of South Africans and poverty level among single fathers in the United States with a correlation coefficient (R) of 0.643 and weighted average of 16.1%, a difference of 6.7%.
Single Father Poverty Correlation Summary
| Measurement | Sierra Leonean | South African |
| Minimum | 4.8% | 8.7% |
| Maximum | 52.9% | 59.2% |
| Range | 48.2% | 50.5% |
| Mean | 20.9% | 27.1% |
| Median | 19.7% | 20.9% |
| Interquartile 25% (IQ1) | 13.4% | 15.6% |
| Interquartile 75% (IQ3) | 25.9% | 46.4% |
| Interquartile Range (IQR) | 12.5% | 30.8% |
| Standard Deviation (Sample) | 11.6% | 15.9% |
| Standard Deviation (Population) | 11.5% | 15.3% |
Similar Demographics by Single Father Poverty
Demographics Similar to Sierra Leoneans by Single Father Poverty
In terms of single father poverty, the demographic groups most similar to Sierra Leoneans are Immigrants from Haiti (17.2%, a difference of 0.010%), Immigrants from Albania (17.2%, a difference of 0.090%), Albanian (17.2%, a difference of 0.11%), Immigrants from Jamaica (17.2%, a difference of 0.14%), and Immigrants from Honduras (17.1%, a difference of 0.17%).
| Demographics | Rating | Rank | Single Father Poverty |
| Czechoslovakians | 1.3 /100 | #248 | Tragic 17.1% |
| Canadians | 1.3 /100 | #249 | Tragic 17.1% |
| Austrians | 1.1 /100 | #250 | Tragic 17.1% |
| Luxembourgers | 1.1 /100 | #251 | Tragic 17.1% |
| Croatians | 1.0 /100 | #252 | Tragic 17.1% |
| Cree | 1.0 /100 | #253 | Tragic 17.1% |
| Immigrants | Honduras | 0.9 /100 | #254 | Tragic 17.1% |
| Sierra Leoneans | 0.8 /100 | #255 | Tragic 17.2% |
| Immigrants | Haiti | 0.8 /100 | #256 | Tragic 17.2% |
| Immigrants | Albania | 0.7 /100 | #257 | Tragic 17.2% |
| Albanians | 0.7 /100 | #258 | Tragic 17.2% |
| Immigrants | Jamaica | 0.7 /100 | #259 | Tragic 17.2% |
| Spaniards | 0.6 /100 | #260 | Tragic 17.2% |
| Swiss | 0.5 /100 | #261 | Tragic 17.3% |
| Immigrants | Zaire | 0.4 /100 | #262 | Tragic 17.3% |
Demographics Similar to South Africans by Single Father Poverty
In terms of single father poverty, the demographic groups most similar to South Africans are Jordanian (16.1%, a difference of 0.060%), Nigerian (16.1%, a difference of 0.10%), Colombian (16.1%, a difference of 0.12%), Immigrants from France (16.1%, a difference of 0.12%), and Immigrants from Zimbabwe (16.1%, a difference of 0.18%).
| Demographics | Rating | Rank | Single Father Poverty |
| Immigrants | Mexico | 83.3 /100 | #142 | Excellent 16.0% |
| Immigrants | Central America | 83.1 /100 | #143 | Excellent 16.0% |
| Immigrants | Kuwait | 81.4 /100 | #144 | Excellent 16.0% |
| Immigrants | Western Asia | 80.7 /100 | #145 | Excellent 16.0% |
| Immigrants | Hungary | 78.3 /100 | #146 | Good 16.1% |
| Colombians | 77.1 /100 | #147 | Good 16.1% |
| Nigerians | 76.8 /100 | #148 | Good 16.1% |
| South Africans | 75.1 /100 | #149 | Good 16.1% |
| Jordanians | 74.2 /100 | #150 | Good 16.1% |
| Immigrants | France | 73.1 /100 | #151 | Good 16.1% |
| Immigrants | Zimbabwe | 72.1 /100 | #152 | Good 16.1% |
| Immigrants | Israel | 72.0 /100 | #153 | Good 16.1% |
| Mexicans | 70.1 /100 | #154 | Good 16.1% |
| Immigrants | Nicaragua | 67.8 /100 | #155 | Good 16.2% |
| Immigrants | Jordan | 66.0 /100 | #156 | Good 16.2% |