Immigrants from West Indies vs South African Single Father Poverty
COMPARE
Immigrants from West Indies
South African
Single Father Poverty
Single Father Poverty Comparison
Immigrants from West Indies
South Africans
15.9%
SINGLE FATHER POVERTY
90.8/ 100
METRIC RATING
129th/ 347
METRIC RANK
16.1%
SINGLE FATHER POVERTY
75.1/ 100
METRIC RATING
149th/ 347
METRIC RANK
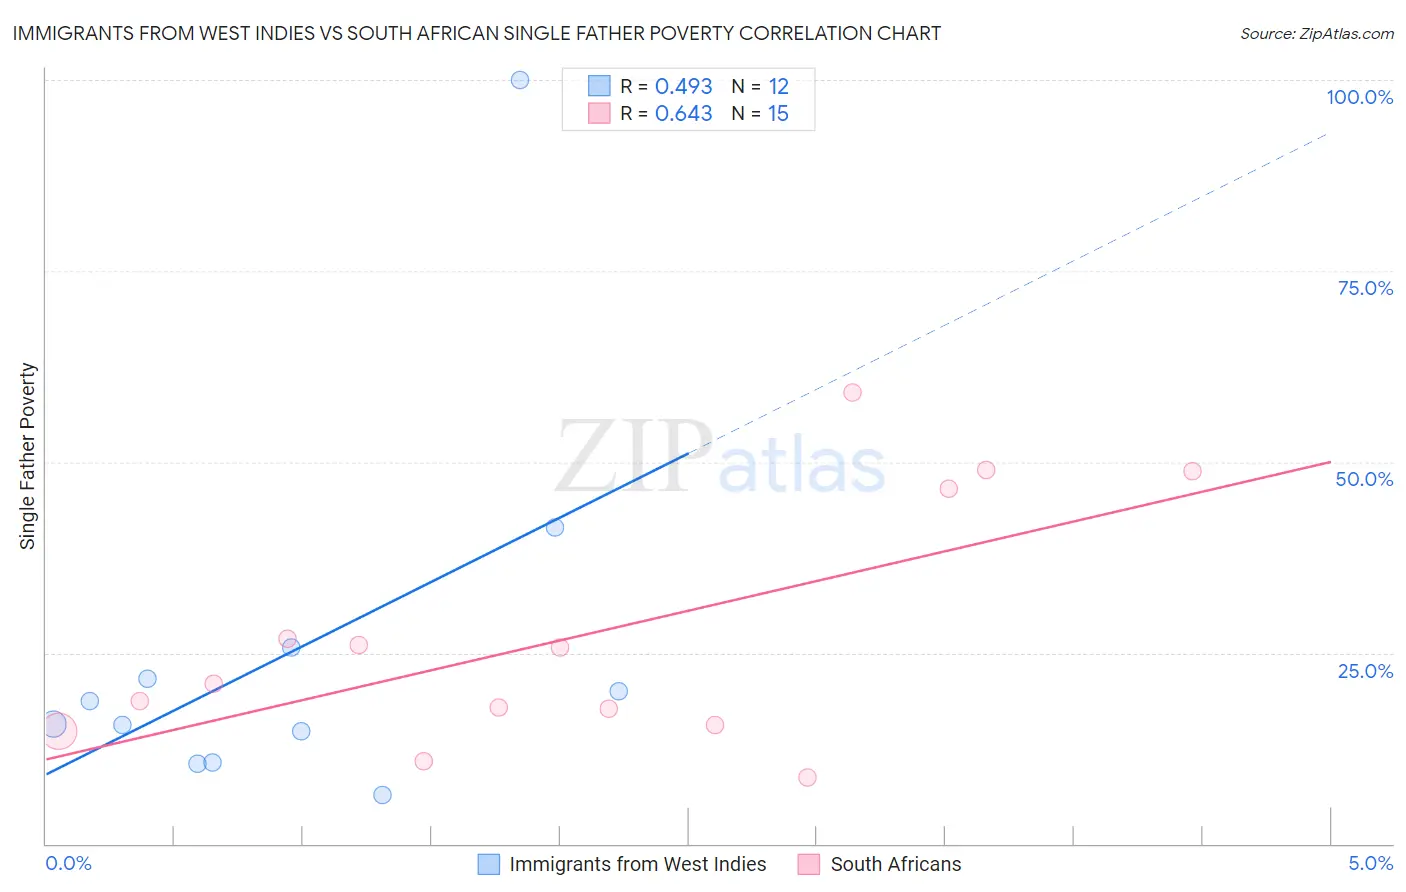
Immigrants from West Indies vs South African Single Father Poverty Correlation Chart
The statistical analysis conducted on geographies consisting of 68,386,268 people shows a moderate positive correlation between the proportion of Immigrants from West Indies and poverty level among single fathers in the United States with a correlation coefficient (R) of 0.493 and weighted average of 15.9%. Similarly, the statistical analysis conducted on geographies consisting of 151,650,915 people shows a significant positive correlation between the proportion of South Africans and poverty level among single fathers in the United States with a correlation coefficient (R) of 0.643 and weighted average of 16.1%, a difference of 1.3%.
Single Father Poverty Correlation Summary
| Measurement | Immigrants from West Indies | South African |
| Minimum | 6.4% | 8.7% |
| Maximum | 100.0% | 59.2% |
| Range | 93.6% | 50.5% |
| Mean | 25.1% | 27.1% |
| Median | 17.2% | 20.9% |
| Interquartile 25% (IQ1) | 12.7% | 15.6% |
| Interquartile 75% (IQ3) | 23.7% | 46.4% |
| Interquartile Range (IQR) | 11.0% | 30.8% |
| Standard Deviation (Sample) | 25.3% | 15.9% |
| Standard Deviation (Population) | 24.2% | 15.3% |
Demographics Similar to Immigrants from West Indies and South Africans by Single Father Poverty
In terms of single father poverty, the demographic groups most similar to Immigrants from West Indies are Norwegian (15.9%, a difference of 0.080%), Nicaraguan (15.9%, a difference of 0.080%), Immigrants from Portugal (15.9%, a difference of 0.14%), Immigrants from Syria (15.9%, a difference of 0.16%), and Immigrants from South America (15.9%, a difference of 0.28%). Similarly, the demographic groups most similar to South Africans are Nigerian (16.1%, a difference of 0.10%), Colombian (16.1%, a difference of 0.12%), Immigrants from Hungary (16.1%, a difference of 0.20%), Immigrants from Western Asia (16.0%, a difference of 0.36%), and Immigrants from Kuwait (16.0%, a difference of 0.42%).
| Demographics | Rating | Rank | Single Father Poverty |
| Immigrants | West Indies | 90.8 /100 | #129 | Exceptional 15.9% |
| Norwegians | 90.2 /100 | #130 | Exceptional 15.9% |
| Nicaraguans | 90.1 /100 | #131 | Exceptional 15.9% |
| Immigrants | Portugal | 89.7 /100 | #132 | Excellent 15.9% |
| Immigrants | Syria | 89.5 /100 | #133 | Excellent 15.9% |
| Immigrants | South America | 88.5 /100 | #134 | Excellent 15.9% |
| Immigrants | Sri Lanka | 88.2 /100 | #135 | Excellent 15.9% |
| Cypriots | 87.5 /100 | #136 | Excellent 15.9% |
| Immigrants | Azores | 87.2 /100 | #137 | Excellent 15.9% |
| Central Americans | 87.1 /100 | #138 | Excellent 16.0% |
| South Americans | 85.9 /100 | #139 | Excellent 16.0% |
| Immigrants | Netherlands | 85.3 /100 | #140 | Excellent 16.0% |
| Liberians | 83.3 /100 | #141 | Excellent 16.0% |
| Immigrants | Mexico | 83.3 /100 | #142 | Excellent 16.0% |
| Immigrants | Central America | 83.1 /100 | #143 | Excellent 16.0% |
| Immigrants | Kuwait | 81.4 /100 | #144 | Excellent 16.0% |
| Immigrants | Western Asia | 80.7 /100 | #145 | Excellent 16.0% |
| Immigrants | Hungary | 78.3 /100 | #146 | Good 16.1% |
| Colombians | 77.1 /100 | #147 | Good 16.1% |
| Nigerians | 76.8 /100 | #148 | Good 16.1% |
| South Africans | 75.1 /100 | #149 | Good 16.1% |