Osage vs Czech Single Father Poverty
COMPARE
Osage
Czech
Single Father Poverty
Single Father Poverty Comparison
Osage
Czechs
19.0%
SINGLE FATHER POVERTY
0.0/ 100
METRIC RATING
316th/ 347
METRIC RANK
17.0%
SINGLE FATHER POVERTY
2.3/ 100
METRIC RATING
241st/ 347
METRIC RANK
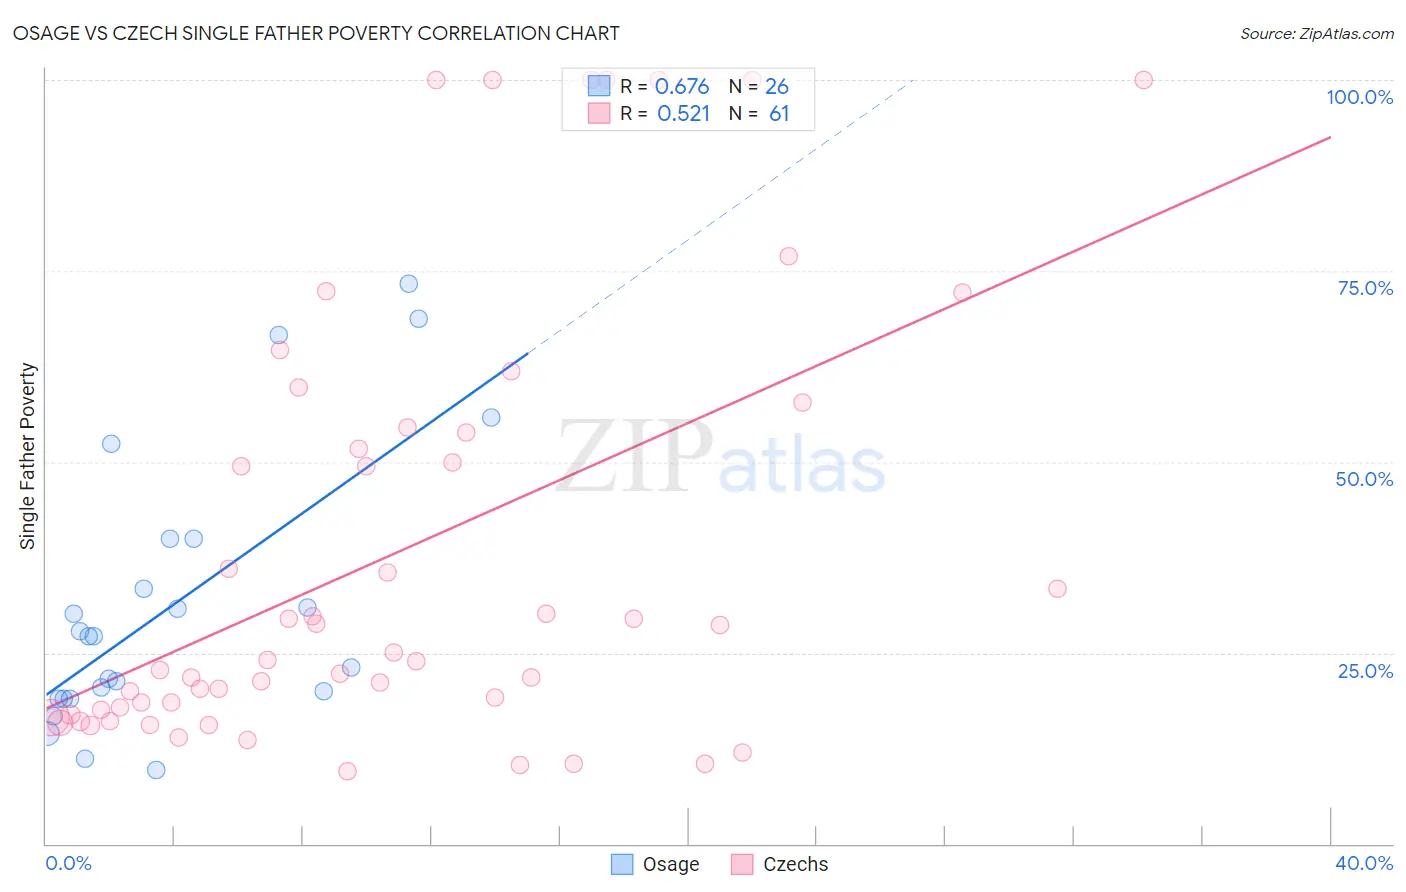
Osage vs Czech Single Father Poverty Correlation Chart
The statistical analysis conducted on geographies consisting of 82,975,637 people shows a significant positive correlation between the proportion of Osage and poverty level among single fathers in the United States with a correlation coefficient (R) of 0.676 and weighted average of 19.0%. Similarly, the statistical analysis conducted on geographies consisting of 358,801,462 people shows a substantial positive correlation between the proportion of Czechs and poverty level among single fathers in the United States with a correlation coefficient (R) of 0.521 and weighted average of 17.0%, a difference of 12.2%.
Single Father Poverty Correlation Summary
| Measurement | Osage | Czech |
| Minimum | 9.7% | 9.5% |
| Maximum | 73.3% | 100.0% |
| Range | 63.7% | 90.5% |
| Mean | 31.5% | 38.0% |
| Median | 27.1% | 24.1% |
| Interquartile 25% (IQ1) | 19.0% | 17.3% |
| Interquartile 75% (IQ3) | 40.0% | 54.2% |
| Interquartile Range (IQR) | 21.0% | 36.9% |
| Standard Deviation (Sample) | 17.9% | 28.4% |
| Standard Deviation (Population) | 17.5% | 28.2% |
Similar Demographics by Single Father Poverty
Demographics Similar to Osage by Single Father Poverty
In terms of single father poverty, the demographic groups most similar to Osage are Dominican (19.1%, a difference of 0.31%), Chickasaw (19.0%, a difference of 0.40%), Delaware (18.9%, a difference of 0.56%), Potawatomi (18.9%, a difference of 0.72%), and Dutch West Indian (19.2%, a difference of 0.89%).
| Demographics | Rating | Rank | Single Father Poverty |
| Immigrants | Micronesia | 0.0 /100 | #309 | Tragic 18.6% |
| Chippewa | 0.0 /100 | #310 | Tragic 18.8% |
| Immigrants | Nonimmigrants | 0.0 /100 | #311 | Tragic 18.8% |
| Immigrants | Dominica | 0.0 /100 | #312 | Tragic 18.9% |
| Potawatomi | 0.0 /100 | #313 | Tragic 18.9% |
| Delaware | 0.0 /100 | #314 | Tragic 18.9% |
| Chickasaw | 0.0 /100 | #315 | Tragic 19.0% |
| Osage | 0.0 /100 | #316 | Tragic 19.0% |
| Dominicans | 0.0 /100 | #317 | Tragic 19.1% |
| Dutch West Indians | 0.0 /100 | #318 | Tragic 19.2% |
| Slovaks | 0.0 /100 | #319 | Tragic 19.3% |
| Inupiat | 0.0 /100 | #320 | Tragic 19.5% |
| Cherokee | 0.0 /100 | #321 | Tragic 19.6% |
| Creek | 0.0 /100 | #322 | Tragic 19.8% |
| Pennsylvania Germans | 0.0 /100 | #323 | Tragic 20.0% |
Demographics Similar to Czechs by Single Father Poverty
In terms of single father poverty, the demographic groups most similar to Czechs are Moroccan (17.0%, a difference of 0.10%), Finnish (16.9%, a difference of 0.12%), Bermudan (16.9%, a difference of 0.13%), Immigrants from Saudi Arabia (16.9%, a difference of 0.15%), and Subsaharan African (16.9%, a difference of 0.22%).
| Demographics | Rating | Rank | Single Father Poverty |
| Marshallese | 3.1 /100 | #234 | Tragic 16.9% |
| Immigrants | Western Europe | 2.9 /100 | #235 | Tragic 16.9% |
| Immigrants | Germany | 2.9 /100 | #236 | Tragic 16.9% |
| Sub-Saharan Africans | 2.9 /100 | #237 | Tragic 16.9% |
| Immigrants | Saudi Arabia | 2.7 /100 | #238 | Tragic 16.9% |
| Bermudans | 2.6 /100 | #239 | Tragic 16.9% |
| Finns | 2.6 /100 | #240 | Tragic 16.9% |
| Czechs | 2.3 /100 | #241 | Tragic 17.0% |
| Moroccans | 2.1 /100 | #242 | Tragic 17.0% |
| Immigrants | Cabo Verde | 1.6 /100 | #243 | Tragic 17.0% |
| Hondurans | 1.6 /100 | #244 | Tragic 17.0% |
| Trinidadians and Tobagonians | 1.5 /100 | #245 | Tragic 17.0% |
| Immigrants | Ireland | 1.4 /100 | #246 | Tragic 17.1% |
| Greeks | 1.3 /100 | #247 | Tragic 17.1% |
| Czechoslovakians | 1.3 /100 | #248 | Tragic 17.1% |