Immigrants from Germany vs Czech Single Father Poverty
COMPARE
Immigrants from Germany
Czech
Single Father Poverty
Single Father Poverty Comparison
Immigrants from Germany
Czechs
16.9%
SINGLE FATHER POVERTY
2.9/ 100
METRIC RATING
236th/ 347
METRIC RANK
17.0%
SINGLE FATHER POVERTY
2.3/ 100
METRIC RATING
241st/ 347
METRIC RANK
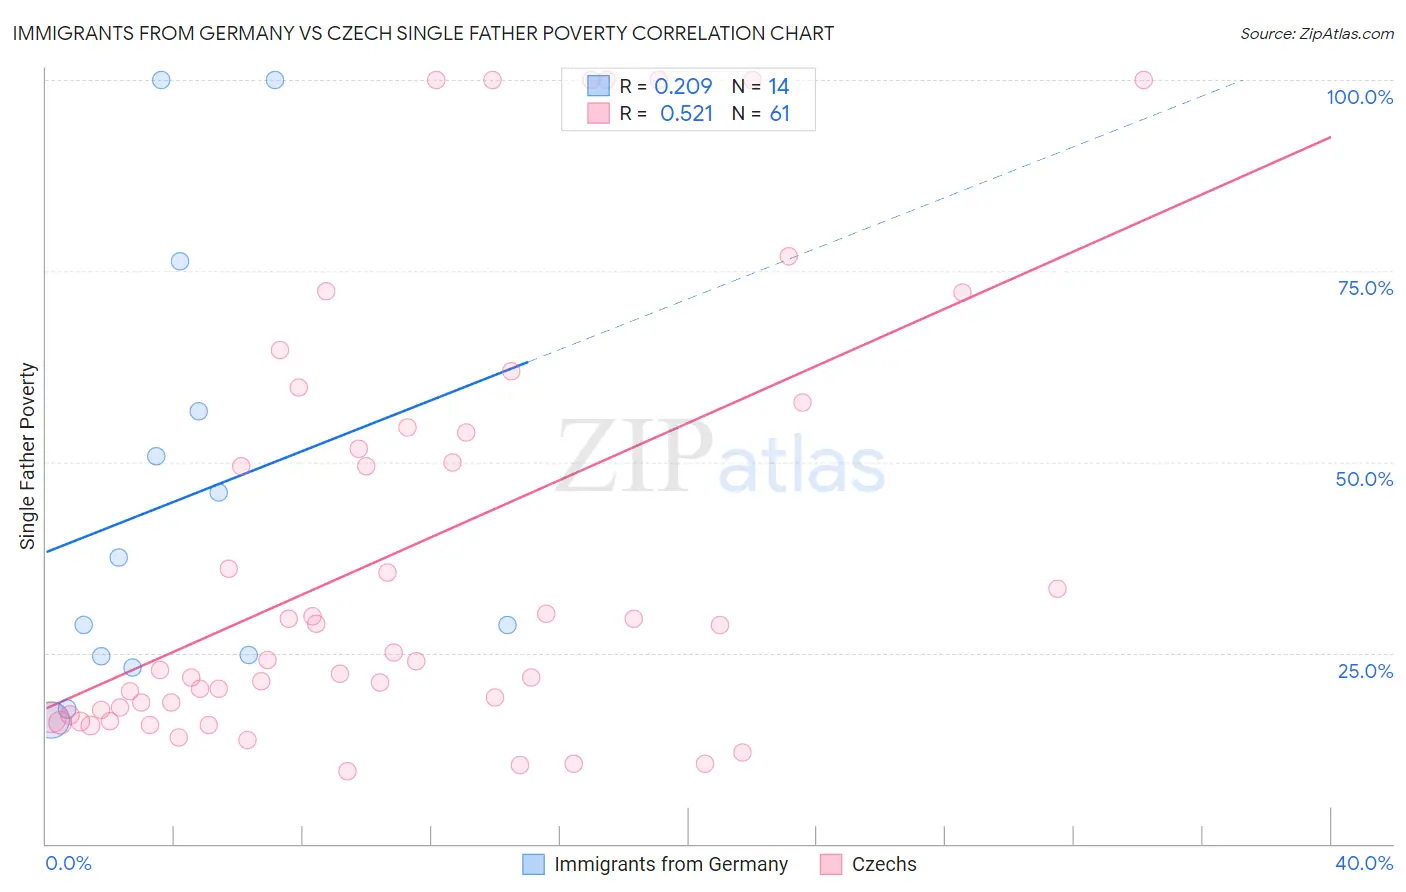
Immigrants from Germany vs Czech Single Father Poverty Correlation Chart
The statistical analysis conducted on geographies consisting of 353,765,959 people shows a weak positive correlation between the proportion of Immigrants from Germany and poverty level among single fathers in the United States with a correlation coefficient (R) of 0.209 and weighted average of 16.9%. Similarly, the statistical analysis conducted on geographies consisting of 358,801,462 people shows a substantial positive correlation between the proportion of Czechs and poverty level among single fathers in the United States with a correlation coefficient (R) of 0.521 and weighted average of 17.0%, a difference of 0.23%.
Single Father Poverty Correlation Summary
| Measurement | Immigrants from Germany | Czech |
| Minimum | 16.1% | 9.5% |
| Maximum | 100.0% | 100.0% |
| Range | 83.9% | 90.5% |
| Mean | 45.0% | 38.0% |
| Median | 33.0% | 24.1% |
| Interquartile 25% (IQ1) | 24.6% | 17.3% |
| Interquartile 75% (IQ3) | 56.6% | 54.2% |
| Interquartile Range (IQR) | 32.0% | 36.9% |
| Standard Deviation (Sample) | 28.7% | 28.4% |
| Standard Deviation (Population) | 27.6% | 28.2% |
Demographics Similar to Immigrants from Germany and Czechs by Single Father Poverty
In terms of single father poverty, the demographic groups most similar to Immigrants from Germany are Immigrants from Western Europe (16.9%, a difference of 0.0%), Subsaharan African (16.9%, a difference of 0.0%), Immigrants from Saudi Arabia (16.9%, a difference of 0.070%), Bermudan (16.9%, a difference of 0.090%), and Marshallese (16.9%, a difference of 0.10%). Similarly, the demographic groups most similar to Czechs are Moroccan (17.0%, a difference of 0.10%), Finnish (16.9%, a difference of 0.12%), Bermudan (16.9%, a difference of 0.13%), Immigrants from Saudi Arabia (16.9%, a difference of 0.15%), and Subsaharan African (16.9%, a difference of 0.22%).
| Demographics | Rating | Rank | Single Father Poverty |
| Belgians | 5.3 /100 | #228 | Tragic 16.8% |
| Israelis | 4.6 /100 | #229 | Tragic 16.8% |
| Immigrants | Trinidad and Tobago | 4.5 /100 | #230 | Tragic 16.8% |
| Spanish Americans | 3.7 /100 | #231 | Tragic 16.9% |
| Immigrants | Grenada | 3.7 /100 | #232 | Tragic 16.9% |
| Senegalese | 3.2 /100 | #233 | Tragic 16.9% |
| Marshallese | 3.1 /100 | #234 | Tragic 16.9% |
| Immigrants | Western Europe | 2.9 /100 | #235 | Tragic 16.9% |
| Immigrants | Germany | 2.9 /100 | #236 | Tragic 16.9% |
| Sub-Saharan Africans | 2.9 /100 | #237 | Tragic 16.9% |
| Immigrants | Saudi Arabia | 2.7 /100 | #238 | Tragic 16.9% |
| Bermudans | 2.6 /100 | #239 | Tragic 16.9% |
| Finns | 2.6 /100 | #240 | Tragic 16.9% |
| Czechs | 2.3 /100 | #241 | Tragic 17.0% |
| Moroccans | 2.1 /100 | #242 | Tragic 17.0% |
| Immigrants | Cabo Verde | 1.6 /100 | #243 | Tragic 17.0% |
| Hondurans | 1.6 /100 | #244 | Tragic 17.0% |
| Trinidadians and Tobagonians | 1.5 /100 | #245 | Tragic 17.0% |
| Immigrants | Ireland | 1.4 /100 | #246 | Tragic 17.1% |
| Greeks | 1.3 /100 | #247 | Tragic 17.1% |
| Czechoslovakians | 1.3 /100 | #248 | Tragic 17.1% |