French Canadian vs Czech Single Father Poverty
COMPARE
French Canadian
Czech
Single Father Poverty
Single Father Poverty Comparison
French Canadians
Czechs
18.6%
SINGLE FATHER POVERTY
0.0/ 100
METRIC RATING
307th/ 347
METRIC RANK
17.0%
SINGLE FATHER POVERTY
2.3/ 100
METRIC RATING
241st/ 347
METRIC RANK
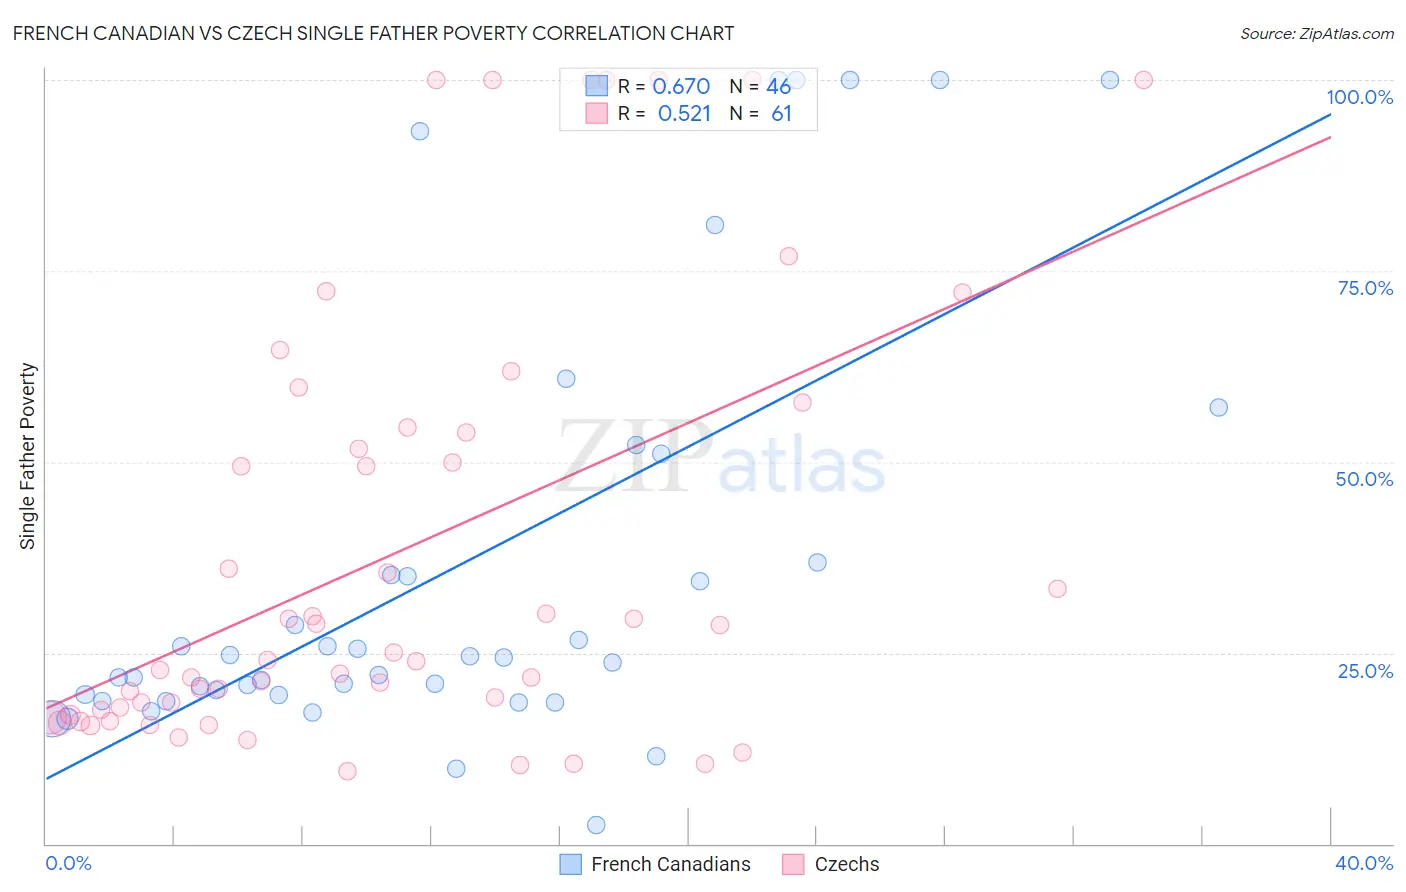
French Canadian vs Czech Single Father Poverty Correlation Chart
The statistical analysis conducted on geographies consisting of 372,635,885 people shows a significant positive correlation between the proportion of French Canadians and poverty level among single fathers in the United States with a correlation coefficient (R) of 0.670 and weighted average of 18.6%. Similarly, the statistical analysis conducted on geographies consisting of 358,801,462 people shows a substantial positive correlation between the proportion of Czechs and poverty level among single fathers in the United States with a correlation coefficient (R) of 0.521 and weighted average of 17.0%, a difference of 9.4%.
Single Father Poverty Correlation Summary
| Measurement | French Canadian | Czech |
| Minimum | 2.5% | 9.5% |
| Maximum | 100.0% | 100.0% |
| Range | 97.5% | 90.5% |
| Mean | 36.1% | 38.0% |
| Median | 24.1% | 24.1% |
| Interquartile 25% (IQ1) | 19.5% | 17.3% |
| Interquartile 75% (IQ3) | 36.8% | 54.2% |
| Interquartile Range (IQR) | 17.3% | 36.9% |
| Standard Deviation (Sample) | 28.3% | 28.4% |
| Standard Deviation (Population) | 28.0% | 28.2% |
Similar Demographics by Single Father Poverty
Demographics Similar to French Canadians by Single Father Poverty
In terms of single father poverty, the demographic groups most similar to French Canadians are Ottawa (18.6%, a difference of 0.020%), Scotch-Irish (18.6%, a difference of 0.040%), Immigrants from Micronesia (18.6%, a difference of 0.13%), Blackfeet (18.5%, a difference of 0.26%), and Ute (18.5%, a difference of 0.31%).
| Demographics | Rating | Rank | Single Father Poverty |
| Immigrants | Dominican Republic | 0.0 /100 | #300 | Tragic 18.4% |
| Hungarians | 0.0 /100 | #301 | Tragic 18.5% |
| Comanche | 0.0 /100 | #302 | Tragic 18.5% |
| Celtics | 0.0 /100 | #303 | Tragic 18.5% |
| Ute | 0.0 /100 | #304 | Tragic 18.5% |
| Blackfeet | 0.0 /100 | #305 | Tragic 18.5% |
| Scotch-Irish | 0.0 /100 | #306 | Tragic 18.6% |
| French Canadians | 0.0 /100 | #307 | Tragic 18.6% |
| Ottawa | 0.0 /100 | #308 | Tragic 18.6% |
| Immigrants | Micronesia | 0.0 /100 | #309 | Tragic 18.6% |
| Chippewa | 0.0 /100 | #310 | Tragic 18.8% |
| Immigrants | Nonimmigrants | 0.0 /100 | #311 | Tragic 18.8% |
| Immigrants | Dominica | 0.0 /100 | #312 | Tragic 18.9% |
| Potawatomi | 0.0 /100 | #313 | Tragic 18.9% |
| Delaware | 0.0 /100 | #314 | Tragic 18.9% |
Demographics Similar to Czechs by Single Father Poverty
In terms of single father poverty, the demographic groups most similar to Czechs are Moroccan (17.0%, a difference of 0.10%), Finnish (16.9%, a difference of 0.12%), Bermudan (16.9%, a difference of 0.13%), Immigrants from Saudi Arabia (16.9%, a difference of 0.15%), and Subsaharan African (16.9%, a difference of 0.22%).
| Demographics | Rating | Rank | Single Father Poverty |
| Marshallese | 3.1 /100 | #234 | Tragic 16.9% |
| Immigrants | Western Europe | 2.9 /100 | #235 | Tragic 16.9% |
| Immigrants | Germany | 2.9 /100 | #236 | Tragic 16.9% |
| Sub-Saharan Africans | 2.9 /100 | #237 | Tragic 16.9% |
| Immigrants | Saudi Arabia | 2.7 /100 | #238 | Tragic 16.9% |
| Bermudans | 2.6 /100 | #239 | Tragic 16.9% |
| Finns | 2.6 /100 | #240 | Tragic 16.9% |
| Czechs | 2.3 /100 | #241 | Tragic 17.0% |
| Moroccans | 2.1 /100 | #242 | Tragic 17.0% |
| Immigrants | Cabo Verde | 1.6 /100 | #243 | Tragic 17.0% |
| Hondurans | 1.6 /100 | #244 | Tragic 17.0% |
| Trinidadians and Tobagonians | 1.5 /100 | #245 | Tragic 17.0% |
| Immigrants | Ireland | 1.4 /100 | #246 | Tragic 17.1% |
| Greeks | 1.3 /100 | #247 | Tragic 17.1% |
| Czechoslovakians | 1.3 /100 | #248 | Tragic 17.1% |