Okinawan vs Scotch-Irish Single Mother Poverty
COMPARE
Okinawan
Scotch-Irish
Single Mother Poverty
Single Mother Poverty Comparison
Okinawans
Scotch-Irish
26.6%
SINGLE MOTHER POVERTY
99.9/ 100
METRIC RATING
36th/ 347
METRIC RANK
31.5%
SINGLE MOTHER POVERTY
0.1/ 100
METRIC RATING
269th/ 347
METRIC RANK
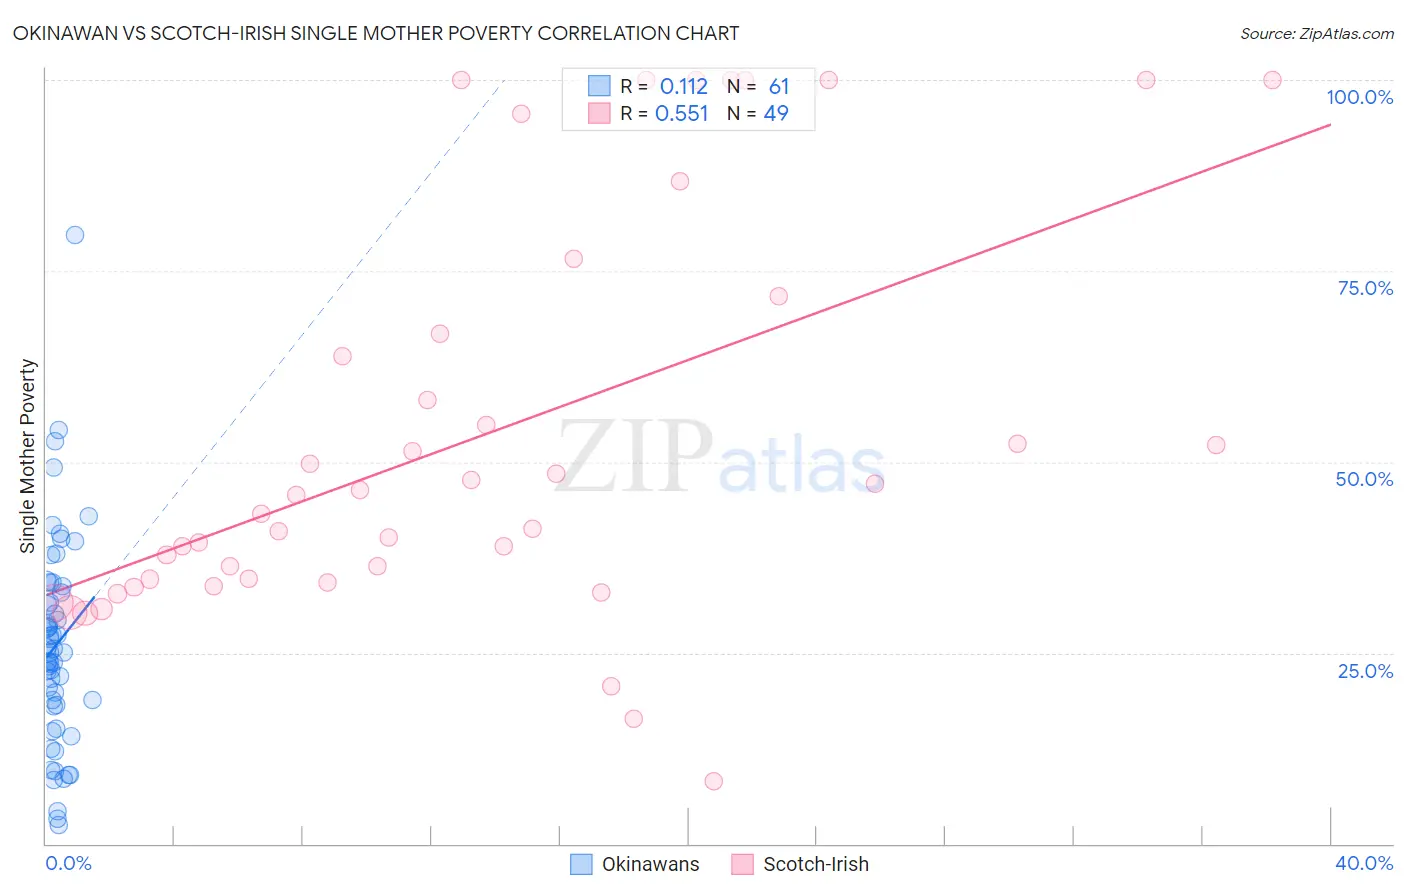
Okinawan vs Scotch-Irish Single Mother Poverty Correlation Chart
The statistical analysis conducted on geographies consisting of 73,055,809 people shows a poor positive correlation between the proportion of Okinawans and poverty level among single mothers in the United States with a correlation coefficient (R) of 0.112 and weighted average of 26.6%. Similarly, the statistical analysis conducted on geographies consisting of 524,083,922 people shows a substantial positive correlation between the proportion of Scotch-Irish and poverty level among single mothers in the United States with a correlation coefficient (R) of 0.551 and weighted average of 31.5%, a difference of 18.4%.
Single Mother Poverty Correlation Summary
| Measurement | Okinawan | Scotch-Irish |
| Minimum | 2.5% | 8.1% |
| Maximum | 79.7% | 100.0% |
| Range | 77.3% | 91.9% |
| Mean | 26.0% | 53.3% |
| Median | 25.0% | 45.6% |
| Interquartile 25% (IQ1) | 18.1% | 34.5% |
| Interquartile 75% (IQ3) | 33.4% | 69.2% |
| Interquartile Range (IQR) | 15.3% | 34.7% |
| Standard Deviation (Sample) | 13.7% | 26.2% |
| Standard Deviation (Population) | 13.6% | 25.9% |
Similar Demographics by Single Mother Poverty
Demographics Similar to Okinawans by Single Mother Poverty
In terms of single mother poverty, the demographic groups most similar to Okinawans are Immigrants from Israel (26.6%, a difference of 0.0%), Immigrants from Fiji (26.6%, a difference of 0.040%), Maltese (26.6%, a difference of 0.050%), Immigrants from Indonesia (26.6%, a difference of 0.17%), and Bulgarian (26.5%, a difference of 0.18%).
| Demographics | Rating | Rank | Single Mother Poverty |
| Jordanians | 100.0 /100 | #29 | Exceptional 26.4% |
| Turks | 100.0 /100 | #30 | Exceptional 26.4% |
| Immigrants | Philippines | 100.0 /100 | #31 | Exceptional 26.5% |
| Tongans | 99.9 /100 | #32 | Exceptional 26.5% |
| Bulgarians | 99.9 /100 | #33 | Exceptional 26.5% |
| Immigrants | Indonesia | 99.9 /100 | #34 | Exceptional 26.6% |
| Maltese | 99.9 /100 | #35 | Exceptional 26.6% |
| Okinawans | 99.9 /100 | #36 | Exceptional 26.6% |
| Immigrants | Israel | 99.9 /100 | #37 | Exceptional 26.6% |
| Immigrants | Fiji | 99.9 /100 | #38 | Exceptional 26.6% |
| Sri Lankans | 99.9 /100 | #39 | Exceptional 26.7% |
| Immigrants | Vietnam | 99.9 /100 | #40 | Exceptional 26.7% |
| Immigrants | Greece | 99.9 /100 | #41 | Exceptional 26.7% |
| Armenians | 99.9 /100 | #42 | Exceptional 26.8% |
| Tsimshian | 99.9 /100 | #43 | Exceptional 26.8% |
Demographics Similar to Scotch-Irish by Single Mother Poverty
In terms of single mother poverty, the demographic groups most similar to Scotch-Irish are Immigrants from Senegal (31.5%, a difference of 0.040%), British West Indian (31.5%, a difference of 0.050%), Immigrants from Belize (31.4%, a difference of 0.22%), Immigrants from Cabo Verde (31.6%, a difference of 0.29%), and Immigrants from Micronesia (31.6%, a difference of 0.30%).
| Demographics | Rating | Rank | Single Mother Poverty |
| Hmong | 0.3 /100 | #262 | Tragic 31.2% |
| Bahamians | 0.2 /100 | #263 | Tragic 31.3% |
| Immigrants | Ecuador | 0.2 /100 | #264 | Tragic 31.3% |
| German Russians | 0.2 /100 | #265 | Tragic 31.3% |
| Sub-Saharan Africans | 0.2 /100 | #266 | Tragic 31.4% |
| Immigrants | Belize | 0.2 /100 | #267 | Tragic 31.4% |
| Immigrants | Senegal | 0.1 /100 | #268 | Tragic 31.5% |
| Scotch-Irish | 0.1 /100 | #269 | Tragic 31.5% |
| British West Indians | 0.1 /100 | #270 | Tragic 31.5% |
| Immigrants | Cabo Verde | 0.1 /100 | #271 | Tragic 31.6% |
| Immigrants | Micronesia | 0.1 /100 | #272 | Tragic 31.6% |
| Fijians | 0.1 /100 | #273 | Tragic 31.6% |
| Bangladeshis | 0.1 /100 | #274 | Tragic 31.7% |
| Central Americans | 0.1 /100 | #275 | Tragic 31.8% |
| Delaware | 0.0 /100 | #276 | Tragic 31.8% |