Okinawan vs Immigrants from Cambodia Single Female Poverty
COMPARE
Okinawan
Immigrants from Cambodia
Single Female Poverty
Single Female Poverty Comparison
Okinawans
Immigrants from Cambodia
18.8%
SINGLE FEMALE POVERTY
99.9/ 100
METRIC RATING
40th/ 347
METRIC RANK
21.2%
SINGLE FEMALE POVERTY
38.2/ 100
METRIC RATING
185th/ 347
METRIC RANK
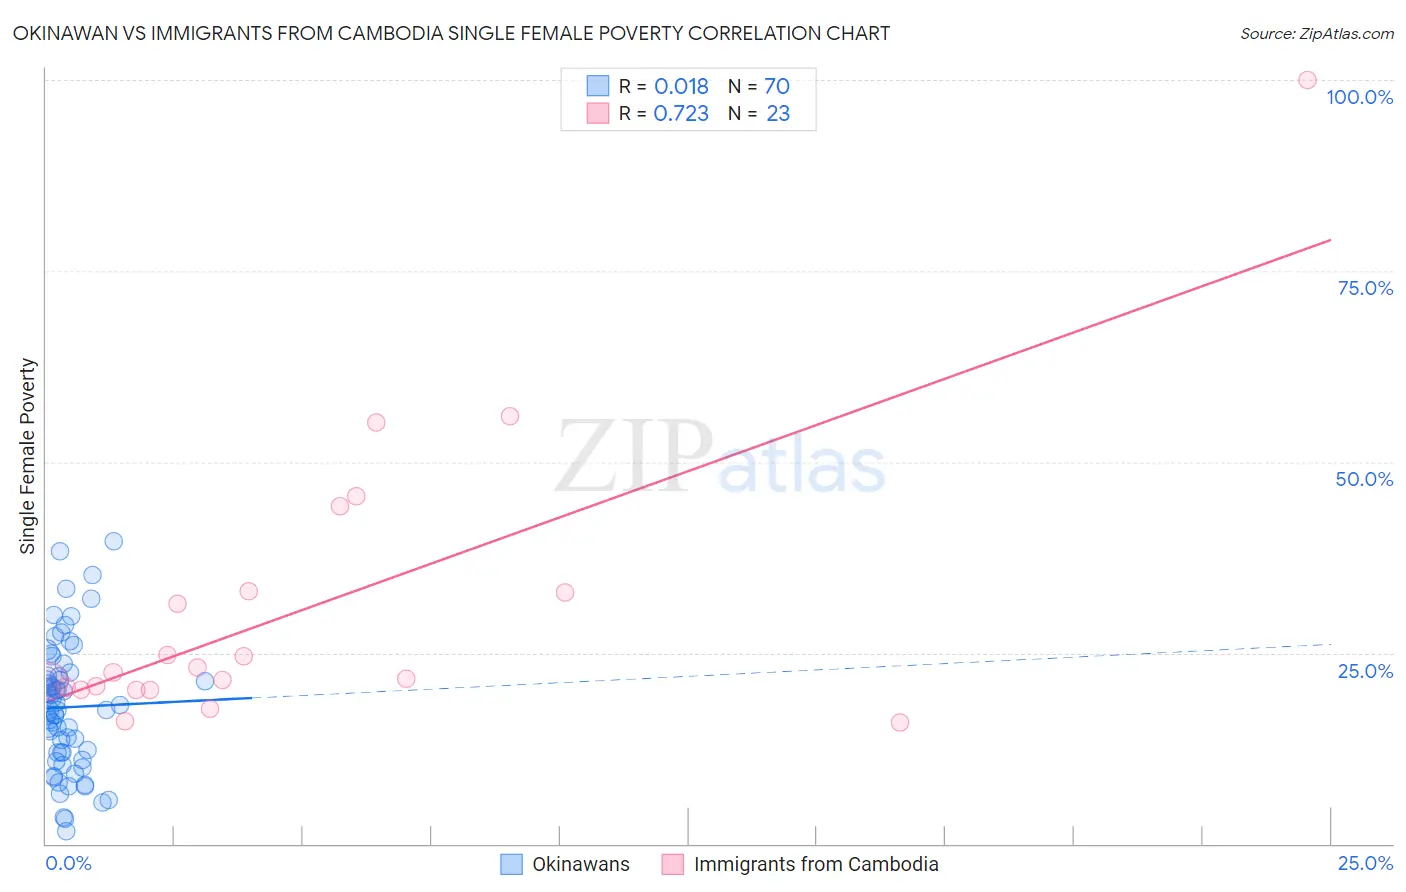
Okinawan vs Immigrants from Cambodia Single Female Poverty Correlation Chart
The statistical analysis conducted on geographies consisting of 73,373,565 people shows no correlation between the proportion of Okinawans and poverty level among single females in the United States with a correlation coefficient (R) of 0.018 and weighted average of 18.8%. Similarly, the statistical analysis conducted on geographies consisting of 204,042,246 people shows a strong positive correlation between the proportion of Immigrants from Cambodia and poverty level among single females in the United States with a correlation coefficient (R) of 0.723 and weighted average of 21.2%, a difference of 12.6%.
Single Female Poverty Correlation Summary
| Measurement | Okinawan | Immigrants from Cambodia |
| Minimum | 1.6% | 15.9% |
| Maximum | 39.6% | 100.0% |
| Range | 38.0% | 84.1% |
| Mean | 17.9% | 30.8% |
| Median | 17.5% | 22.4% |
| Interquartile 25% (IQ1) | 11.9% | 20.2% |
| Interquartile 75% (IQ3) | 21.9% | 33.1% |
| Interquartile Range (IQR) | 10.0% | 12.9% |
| Standard Deviation (Sample) | 8.4% | 19.1% |
| Standard Deviation (Population) | 8.4% | 18.7% |
Similar Demographics by Single Female Poverty
Demographics Similar to Okinawans by Single Female Poverty
In terms of single female poverty, the demographic groups most similar to Okinawans are Immigrants from Serbia (18.8%, a difference of 0.020%), Bulgarian (18.8%, a difference of 0.030%), Tongan (18.8%, a difference of 0.060%), Jordanian (18.8%, a difference of 0.090%), and Immigrants from Romania (18.8%, a difference of 0.25%).
| Demographics | Rating | Rank | Single Female Poverty |
| Immigrants | Philippines | 99.9 /100 | #33 | Exceptional 18.6% |
| Koreans | 99.9 /100 | #34 | Exceptional 18.6% |
| Immigrants | Japan | 99.9 /100 | #35 | Exceptional 18.6% |
| Turks | 99.9 /100 | #36 | Exceptional 18.7% |
| Immigrants | Armenia | 99.9 /100 | #37 | Exceptional 18.7% |
| Tongans | 99.9 /100 | #38 | Exceptional 18.8% |
| Bulgarians | 99.9 /100 | #39 | Exceptional 18.8% |
| Okinawans | 99.9 /100 | #40 | Exceptional 18.8% |
| Immigrants | Serbia | 99.9 /100 | #41 | Exceptional 18.8% |
| Jordanians | 99.9 /100 | #42 | Exceptional 18.8% |
| Immigrants | Romania | 99.9 /100 | #43 | Exceptional 18.8% |
| Immigrants | Croatia | 99.9 /100 | #44 | Exceptional 18.9% |
| Immigrants | Indonesia | 99.8 /100 | #45 | Exceptional 18.9% |
| Macedonians | 99.8 /100 | #46 | Exceptional 18.9% |
| Latvians | 99.8 /100 | #47 | Exceptional 19.0% |
Demographics Similar to Immigrants from Cambodia by Single Female Poverty
In terms of single female poverty, the demographic groups most similar to Immigrants from Cambodia are Hawaiian (21.2%, a difference of 0.040%), Hungarian (21.1%, a difference of 0.090%), Slovak (21.1%, a difference of 0.10%), Immigrants from Nigeria (21.2%, a difference of 0.10%), and Slavic (21.1%, a difference of 0.15%).
| Demographics | Rating | Rank | Single Female Poverty |
| Immigrants | Bosnia and Herzegovina | 44.9 /100 | #178 | Average 21.1% |
| British | 42.9 /100 | #179 | Average 21.1% |
| Spanish American Indians | 42.5 /100 | #180 | Average 21.1% |
| Europeans | 42.3 /100 | #181 | Average 21.1% |
| Slavs | 40.5 /100 | #182 | Average 21.1% |
| Slovaks | 39.7 /100 | #183 | Fair 21.1% |
| Hungarians | 39.6 /100 | #184 | Fair 21.1% |
| Immigrants | Cambodia | 38.2 /100 | #185 | Fair 21.2% |
| Hawaiians | 37.7 /100 | #186 | Fair 21.2% |
| Immigrants | Nigeria | 36.8 /100 | #187 | Fair 21.2% |
| Yugoslavians | 35.4 /100 | #188 | Fair 21.2% |
| Immigrants | Cuba | 35.3 /100 | #189 | Fair 21.2% |
| Trinidadians and Tobagonians | 35.2 /100 | #190 | Fair 21.2% |
| Immigrants | Germany | 31.1 /100 | #191 | Fair 21.3% |
| Immigrants | Jamaica | 30.5 /100 | #192 | Fair 21.3% |