Okinawan vs Russian Female Poverty
COMPARE
Okinawan
Russian
Female Poverty
Female Poverty Comparison
Okinawans
Russians
12.4%
FEMALE POVERTY
96.4/ 100
METRIC RATING
87th/ 347
METRIC RANK
11.8%
FEMALE POVERTY
99.3/ 100
METRIC RATING
38th/ 347
METRIC RANK
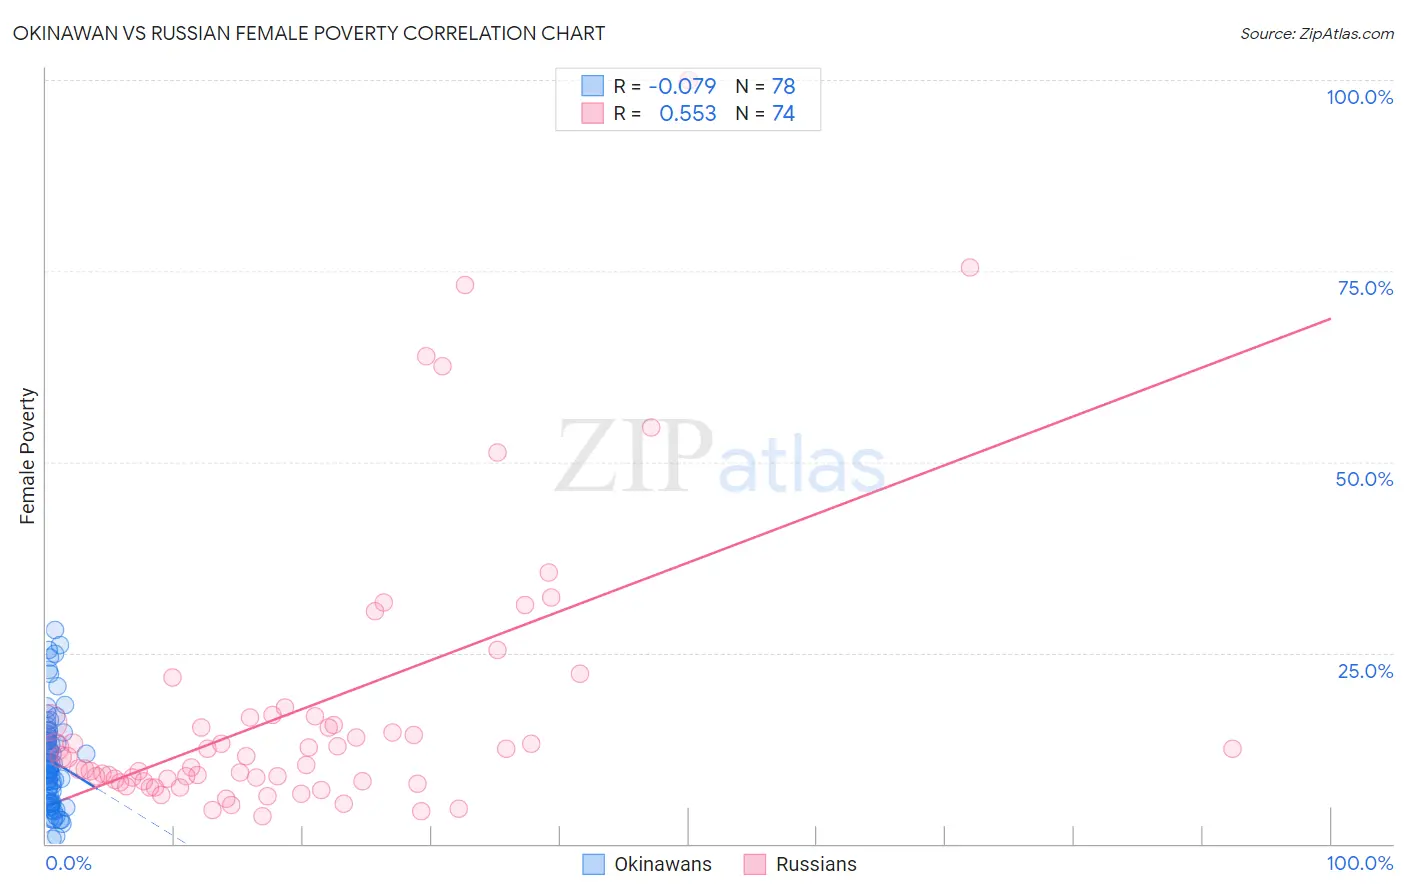
Okinawan vs Russian Female Poverty Correlation Chart
The statistical analysis conducted on geographies consisting of 73,724,084 people shows a slight negative correlation between the proportion of Okinawans and poverty level among females in the United States with a correlation coefficient (R) of -0.079 and weighted average of 12.4%. Similarly, the statistical analysis conducted on geographies consisting of 511,408,549 people shows a substantial positive correlation between the proportion of Russians and poverty level among females in the United States with a correlation coefficient (R) of 0.553 and weighted average of 11.8%, a difference of 4.7%.
Female Poverty Correlation Summary
| Measurement | Okinawan | Russian |
| Minimum | 0.59% | 3.6% |
| Maximum | 28.0% | 100.0% |
| Range | 27.4% | 96.4% |
| Mean | 10.9% | 17.7% |
| Median | 10.1% | 11.4% |
| Interquartile 25% (IQ1) | 5.5% | 8.2% |
| Interquartile 75% (IQ3) | 14.2% | 16.5% |
| Interquartile Range (IQR) | 8.7% | 8.2% |
| Standard Deviation (Sample) | 6.3% | 18.5% |
| Standard Deviation (Population) | 6.2% | 18.4% |
Similar Demographics by Female Poverty
Demographics Similar to Okinawans by Female Poverty
In terms of female poverty, the demographic groups most similar to Okinawans are Dutch (12.4%, a difference of 0.020%), Irish (12.4%, a difference of 0.050%), Finnish (12.4%, a difference of 0.050%), Northern European (12.4%, a difference of 0.10%), and English (12.4%, a difference of 0.24%).
| Demographics | Rating | Rank | Female Poverty |
| Slovaks | 97.1 /100 | #80 | Exceptional 12.3% |
| Immigrants | Sweden | 97.1 /100 | #81 | Exceptional 12.3% |
| Jordanians | 97.1 /100 | #82 | Exceptional 12.3% |
| Immigrants | England | 96.9 /100 | #83 | Exceptional 12.3% |
| Northern Europeans | 96.6 /100 | #84 | Exceptional 12.4% |
| Irish | 96.5 /100 | #85 | Exceptional 12.4% |
| Dutch | 96.5 /100 | #86 | Exceptional 12.4% |
| Okinawans | 96.4 /100 | #87 | Exceptional 12.4% |
| Finns | 96.4 /100 | #88 | Exceptional 12.4% |
| English | 96.1 /100 | #89 | Exceptional 12.4% |
| Immigrants | Denmark | 95.8 /100 | #90 | Exceptional 12.4% |
| Belgians | 95.8 /100 | #91 | Exceptional 12.4% |
| Czechoslovakians | 95.7 /100 | #92 | Exceptional 12.4% |
| Immigrants | Egypt | 95.5 /100 | #93 | Exceptional 12.5% |
| Immigrants | Indonesia | 95.4 /100 | #94 | Exceptional 12.5% |
Demographics Similar to Russians by Female Poverty
In terms of female poverty, the demographic groups most similar to Russians are Immigrants from Greece (11.8%, a difference of 0.020%), Immigrants from Pakistan (11.8%, a difference of 0.11%), Immigrants from Poland (11.8%, a difference of 0.21%), Macedonian (11.8%, a difference of 0.26%), and Immigrants from Iran (11.8%, a difference of 0.28%).
| Demographics | Rating | Rank | Female Poverty |
| Poles | 99.5 /100 | #31 | Exceptional 11.7% |
| Danes | 99.5 /100 | #32 | Exceptional 11.7% |
| Cypriots | 99.5 /100 | #33 | Exceptional 11.8% |
| Immigrants | Singapore | 99.4 /100 | #34 | Exceptional 11.8% |
| Immigrants | Iran | 99.4 /100 | #35 | Exceptional 11.8% |
| Immigrants | Pakistan | 99.4 /100 | #36 | Exceptional 11.8% |
| Immigrants | Greece | 99.3 /100 | #37 | Exceptional 11.8% |
| Russians | 99.3 /100 | #38 | Exceptional 11.8% |
| Immigrants | Poland | 99.3 /100 | #39 | Exceptional 11.8% |
| Macedonians | 99.3 /100 | #40 | Exceptional 11.8% |
| Czechs | 99.2 /100 | #41 | Exceptional 11.9% |
| Immigrants | Moldova | 99.2 /100 | #42 | Exceptional 11.9% |
| Koreans | 99.2 /100 | #43 | Exceptional 11.9% |
| Tongans | 99.2 /100 | #44 | Exceptional 11.9% |
| Immigrants | Czechoslovakia | 99.2 /100 | #45 | Exceptional 11.9% |