Okinawan vs Taiwanese Female Poverty
COMPARE
Okinawan
Taiwanese
Female Poverty
Female Poverty Comparison
Okinawans
Taiwanese
12.4%
FEMALE POVERTY
96.4/ 100
METRIC RATING
87th/ 347
METRIC RANK
13.1%
FEMALE POVERTY
75.7/ 100
METRIC RATING
149th/ 347
METRIC RANK
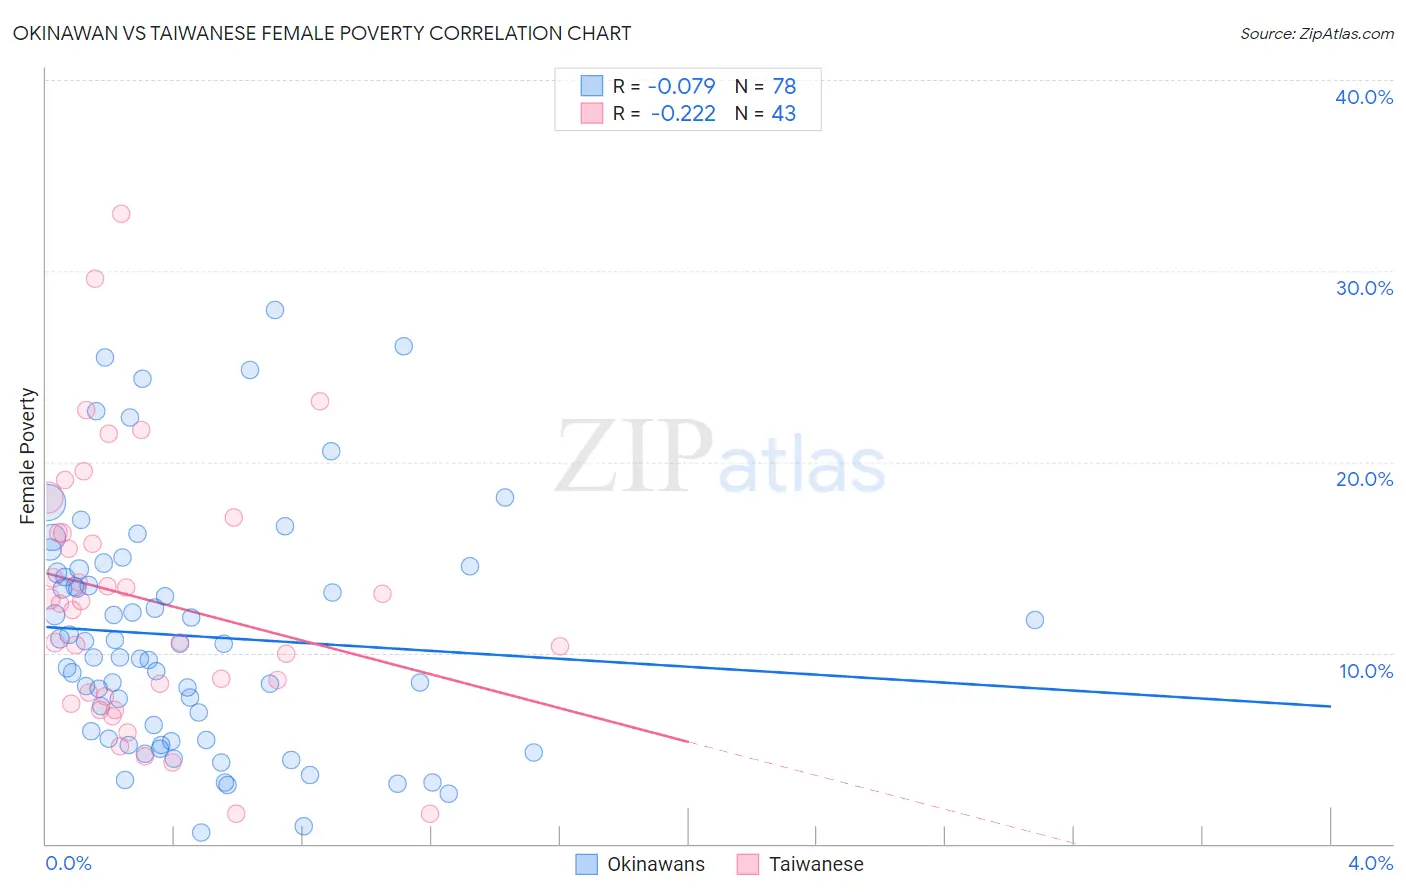
Okinawan vs Taiwanese Female Poverty Correlation Chart
The statistical analysis conducted on geographies consisting of 73,724,084 people shows a slight negative correlation between the proportion of Okinawans and poverty level among females in the United States with a correlation coefficient (R) of -0.079 and weighted average of 12.4%. Similarly, the statistical analysis conducted on geographies consisting of 31,695,393 people shows a weak negative correlation between the proportion of Taiwanese and poverty level among females in the United States with a correlation coefficient (R) of -0.222 and weighted average of 13.1%, a difference of 5.7%.
Female Poverty Correlation Summary
| Measurement | Okinawan | Taiwanese |
| Minimum | 0.59% | 1.6% |
| Maximum | 28.0% | 33.0% |
| Range | 27.4% | 31.4% |
| Mean | 10.9% | 12.8% |
| Median | 10.1% | 12.6% |
| Interquartile 25% (IQ1) | 5.5% | 7.7% |
| Interquartile 75% (IQ3) | 14.2% | 16.3% |
| Interquartile Range (IQR) | 8.7% | 8.6% |
| Standard Deviation (Sample) | 6.3% | 6.9% |
| Standard Deviation (Population) | 6.2% | 6.8% |
Similar Demographics by Female Poverty
Demographics Similar to Okinawans by Female Poverty
In terms of female poverty, the demographic groups most similar to Okinawans are Dutch (12.4%, a difference of 0.020%), Irish (12.4%, a difference of 0.050%), Finnish (12.4%, a difference of 0.050%), Northern European (12.4%, a difference of 0.10%), and English (12.4%, a difference of 0.24%).
| Demographics | Rating | Rank | Female Poverty |
| Slovaks | 97.1 /100 | #80 | Exceptional 12.3% |
| Immigrants | Sweden | 97.1 /100 | #81 | Exceptional 12.3% |
| Jordanians | 97.1 /100 | #82 | Exceptional 12.3% |
| Immigrants | England | 96.9 /100 | #83 | Exceptional 12.3% |
| Northern Europeans | 96.6 /100 | #84 | Exceptional 12.4% |
| Irish | 96.5 /100 | #85 | Exceptional 12.4% |
| Dutch | 96.5 /100 | #86 | Exceptional 12.4% |
| Okinawans | 96.4 /100 | #87 | Exceptional 12.4% |
| Finns | 96.4 /100 | #88 | Exceptional 12.4% |
| English | 96.1 /100 | #89 | Exceptional 12.4% |
| Immigrants | Denmark | 95.8 /100 | #90 | Exceptional 12.4% |
| Belgians | 95.8 /100 | #91 | Exceptional 12.4% |
| Czechoslovakians | 95.7 /100 | #92 | Exceptional 12.4% |
| Immigrants | Egypt | 95.5 /100 | #93 | Exceptional 12.5% |
| Immigrants | Indonesia | 95.4 /100 | #94 | Exceptional 12.5% |
Demographics Similar to Taiwanese by Female Poverty
In terms of female poverty, the demographic groups most similar to Taiwanese are Tsimshian (13.1%, a difference of 0.030%), Immigrants from Germany (13.1%, a difference of 0.10%), Yugoslavian (13.1%, a difference of 0.16%), Samoan (13.1%, a difference of 0.27%), and Immigrants from Kazakhstan (13.0%, a difference of 0.41%).
| Demographics | Rating | Rank | Female Poverty |
| Brazilians | 80.5 /100 | #142 | Excellent 13.0% |
| Immigrants | Malaysia | 80.4 /100 | #143 | Excellent 13.0% |
| Afghans | 79.8 /100 | #144 | Good 13.0% |
| Syrians | 79.6 /100 | #145 | Good 13.0% |
| Immigrants | Peru | 79.1 /100 | #146 | Good 13.0% |
| Immigrants | Kazakhstan | 78.6 /100 | #147 | Good 13.0% |
| Yugoslavians | 76.9 /100 | #148 | Good 13.1% |
| Taiwanese | 75.7 /100 | #149 | Good 13.1% |
| Tsimshian | 75.5 /100 | #150 | Good 13.1% |
| Immigrants | Germany | 74.9 /100 | #151 | Good 13.1% |
| Samoans | 73.6 /100 | #152 | Good 13.1% |
| Immigrants | Fiji | 71.0 /100 | #153 | Good 13.2% |
| Armenians | 70.4 /100 | #154 | Good 13.2% |
| Hungarians | 70.1 /100 | #155 | Good 13.2% |
| Immigrants | Bosnia and Herzegovina | 69.7 /100 | #156 | Good 13.2% |