Navajo vs Hopi Householder Income Over 65 years
COMPARE
Navajo
Hopi
Householder Income Over 65 years
Householder Income Over 65 years Comparison
Navajo
Hopi
$47,722
HOUSEHOLDER INCOME OVER 65 YEARS
0.0/ 100
METRIC RATING
339th/ 347
METRIC RANK
$50,925
HOUSEHOLDER INCOME OVER 65 YEARS
0.0/ 100
METRIC RATING
328th/ 347
METRIC RANK
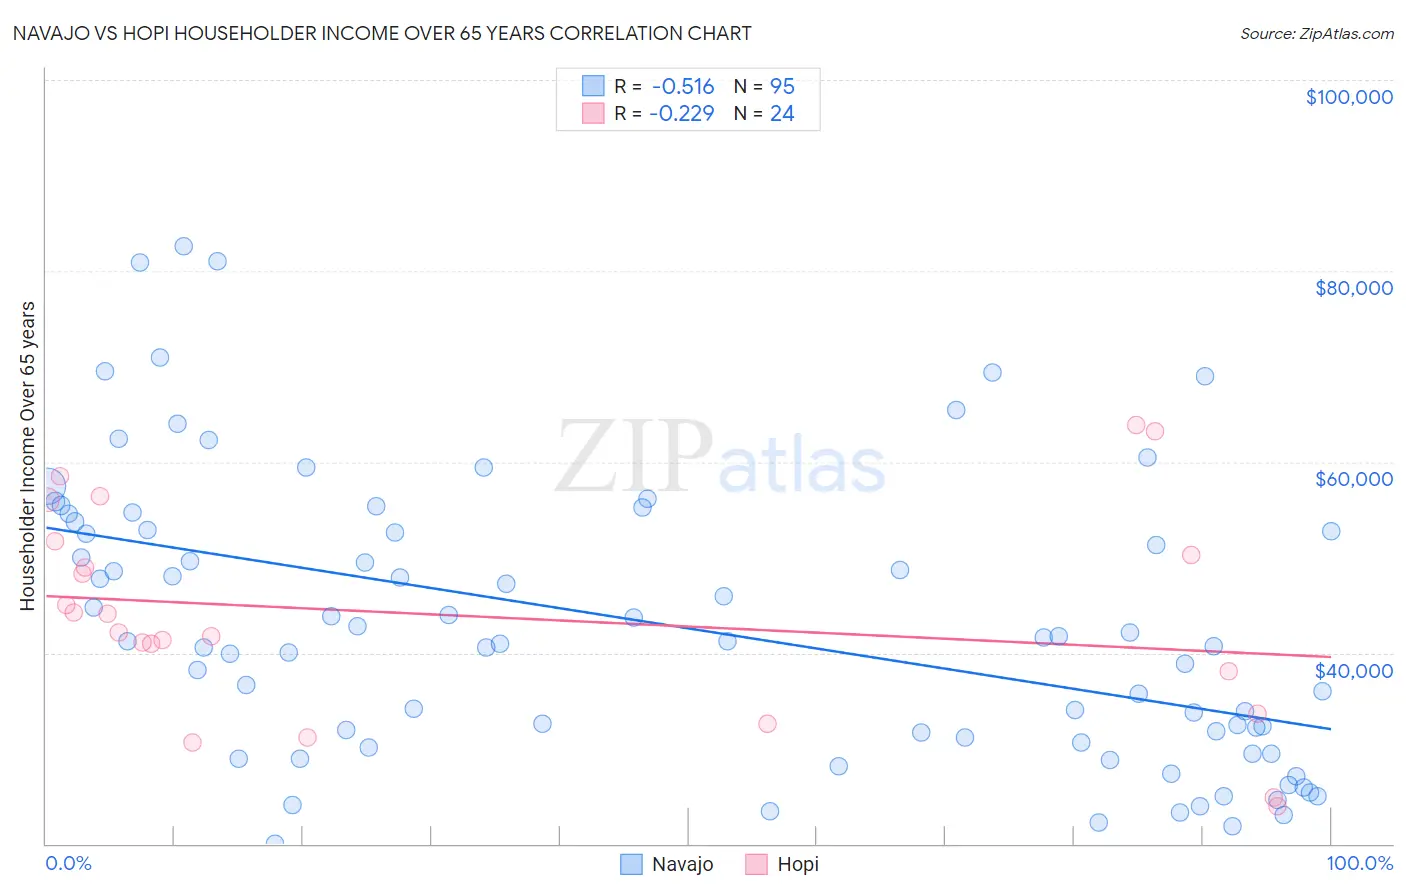
Navajo vs Hopi Householder Income Over 65 years Correlation Chart
The statistical analysis conducted on geographies consisting of 223,856,199 people shows a substantial negative correlation between the proportion of Navajo and household income with householder over the age of 65 in the United States with a correlation coefficient (R) of -0.516 and weighted average of $47,722. Similarly, the statistical analysis conducted on geographies consisting of 74,624,993 people shows a weak negative correlation between the proportion of Hopi and household income with householder over the age of 65 in the United States with a correlation coefficient (R) of -0.229 and weighted average of $50,925, a difference of 6.7%.
Householder Income Over 65 years Correlation Summary
| Measurement | Navajo | Hopi |
| Minimum | $20,040 | $23,945 |
| Maximum | $82,574 | $63,889 |
| Range | $62,535 | $39,944 |
| Mean | $42,837 | $43,849 |
| Median | $41,250 | $43,086 |
| Interquartile 25% (IQ1) | $30,625 | $35,807 |
| Interquartile 75% (IQ3) | $52,850 | $50,986 |
| Interquartile Range (IQR) | $22,225 | $15,179 |
| Standard Deviation (Sample) | $14,837 | $11,101 |
| Standard Deviation (Population) | $14,759 | $10,867 |
Demographics Similar to Navajo and Hopi by Householder Income Over 65 years
In terms of householder income over 65 years, the demographic groups most similar to Navajo are Immigrants from Yemen ($47,527, a difference of 0.41%), Dominican ($46,964, a difference of 1.6%), Immigrants from Caribbean ($48,535, a difference of 1.7%), Immigrants from Cabo Verde ($46,654, a difference of 2.3%), and Tohono O'odham ($49,121, a difference of 2.9%). Similarly, the demographic groups most similar to Hopi are Bahamian ($51,000, a difference of 0.15%), Black/African American ($50,779, a difference of 0.29%), Immigrants from Grenada ($50,747, a difference of 0.35%), Kiowa ($51,140, a difference of 0.42%), and Immigrants from Haiti ($51,219, a difference of 0.58%).
| Demographics | Rating | Rank | Householder Income Over 65 years |
| Cajuns | 0.0 /100 | #323 | Tragic $51,397 |
| Immigrants | Congo | 0.0 /100 | #324 | Tragic $51,393 |
| Immigrants | Haiti | 0.0 /100 | #325 | Tragic $51,219 |
| Kiowa | 0.0 /100 | #326 | Tragic $51,140 |
| Bahamians | 0.0 /100 | #327 | Tragic $51,000 |
| Hopi | 0.0 /100 | #328 | Tragic $50,925 |
| Blacks/African Americans | 0.0 /100 | #329 | Tragic $50,779 |
| Immigrants | Grenada | 0.0 /100 | #330 | Tragic $50,747 |
| Pima | 0.0 /100 | #331 | Tragic $50,539 |
| Dutch West Indians | 0.0 /100 | #332 | Tragic $50,475 |
| Cape Verdeans | 0.0 /100 | #333 | Tragic $50,077 |
| Immigrants | Dominica | 0.0 /100 | #334 | Tragic $50,071 |
| Crow | 0.0 /100 | #335 | Tragic $49,234 |
| Cubans | 0.0 /100 | #336 | Tragic $49,152 |
| Tohono O'odham | 0.0 /100 | #337 | Tragic $49,121 |
| Immigrants | Caribbean | 0.0 /100 | #338 | Tragic $48,535 |
| Navajo | 0.0 /100 | #339 | Tragic $47,722 |
| Immigrants | Yemen | 0.0 /100 | #340 | Tragic $47,527 |
| Dominicans | 0.0 /100 | #341 | Tragic $46,964 |
| Immigrants | Cabo Verde | 0.0 /100 | #342 | Tragic $46,654 |
| Immigrants | Dominican Republic | 0.0 /100 | #343 | Tragic $45,758 |