Navajo vs Hopi Disability Age Over 75
COMPARE
Navajo
Hopi
Disability Age Over 75
Disability Age Over 75 Comparison
Navajo
Hopi
58.3%
DISABILITY AGE OVER 75
0.0/ 100
METRIC RATING
344th/ 347
METRIC RANK
52.9%
DISABILITY AGE OVER 75
0.0/ 100
METRIC RATING
331st/ 347
METRIC RANK
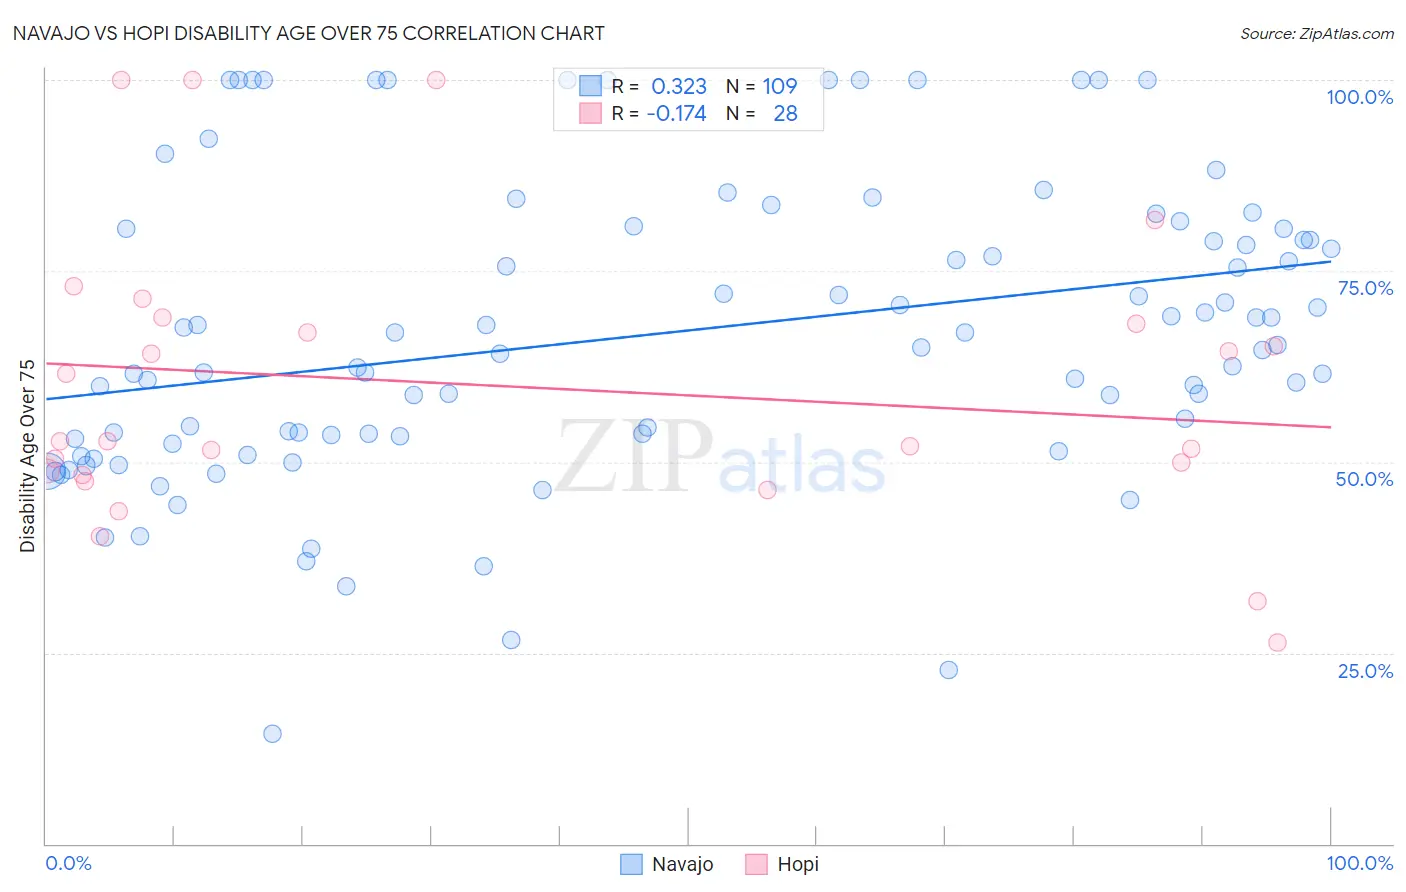
Navajo vs Hopi Disability Age Over 75 Correlation Chart
The statistical analysis conducted on geographies consisting of 224,282,482 people shows a mild positive correlation between the proportion of Navajo and percentage of population with a disability over the age of 75 in the United States with a correlation coefficient (R) of 0.323 and weighted average of 58.3%. Similarly, the statistical analysis conducted on geographies consisting of 74,658,865 people shows a poor negative correlation between the proportion of Hopi and percentage of population with a disability over the age of 75 in the United States with a correlation coefficient (R) of -0.174 and weighted average of 52.9%, a difference of 10.2%.
Disability Age Over 75 Correlation Summary
| Measurement | Navajo | Hopi |
| Minimum | 14.5% | 26.4% |
| Maximum | 100.0% | 100.0% |
| Range | 85.5% | 73.6% |
| Mean | 66.8% | 60.0% |
| Median | 65.0% | 52.7% |
| Interquartile 25% (IQ1) | 53.2% | 48.5% |
| Interquartile 75% (IQ3) | 80.5% | 68.5% |
| Interquartile Range (IQR) | 27.3% | 20.0% |
| Standard Deviation (Sample) | 19.4% | 18.8% |
| Standard Deviation (Population) | 19.3% | 18.5% |
Demographics Similar to Navajo and Hopi by Disability Age Over 75
In terms of disability age over 75, the demographic groups most similar to Navajo are Inupiat (58.4%, a difference of 0.20%), Tsimshian (59.2%, a difference of 1.6%), Tohono O'odham (56.7%, a difference of 2.8%), Lumbee (56.2%, a difference of 3.6%), and Houma (56.2%, a difference of 3.8%). Similarly, the demographic groups most similar to Hopi are Puerto Rican (52.9%, a difference of 0.020%), Alaska Native (52.8%, a difference of 0.19%), Native/Alaskan (53.1%, a difference of 0.29%), Choctaw (52.7%, a difference of 0.41%), and Nepalese (52.6%, a difference of 0.60%).
| Demographics | Rating | Rank | Disability Age Over 75 |
| Nepalese | 0.0 /100 | #327 | Tragic 52.6% |
| Choctaw | 0.0 /100 | #328 | Tragic 52.7% |
| Alaska Natives | 0.0 /100 | #329 | Tragic 52.8% |
| Puerto Ricans | 0.0 /100 | #330 | Tragic 52.9% |
| Hopi | 0.0 /100 | #331 | Tragic 52.9% |
| Natives/Alaskans | 0.0 /100 | #332 | Tragic 53.1% |
| Apache | 0.0 /100 | #333 | Tragic 53.6% |
| Alaskan Athabascans | 0.0 /100 | #334 | Tragic 54.0% |
| Kiowa | 0.0 /100 | #335 | Tragic 54.2% |
| Immigrants | Armenia | 0.0 /100 | #336 | Tragic 54.3% |
| Yuman | 0.0 /100 | #337 | Tragic 54.4% |
| Colville | 0.0 /100 | #338 | Tragic 55.4% |
| Pima | 0.0 /100 | #339 | Tragic 55.8% |
| Pueblo | 0.0 /100 | #340 | Tragic 55.9% |
| Houma | 0.0 /100 | #341 | Tragic 56.2% |
| Lumbee | 0.0 /100 | #342 | Tragic 56.2% |
| Tohono O'odham | 0.0 /100 | #343 | Tragic 56.7% |
| Navajo | 0.0 /100 | #344 | Tragic 58.3% |
| Inupiat | 0.0 /100 | #345 | Tragic 58.4% |
| Tsimshian | 0.0 /100 | #346 | Tragic 59.2% |
| Yup'ik | 0.0 /100 | #347 | Tragic 61.1% |