Alaska Native vs Maltese Poverty
COMPARE
Alaska Native
Maltese
Poverty
Poverty Comparison
Alaska Natives
Maltese
13.5%
POVERTY
2.1/ 100
METRIC RATING
227th/ 347
METRIC RANK
10.2%
POVERTY
99.9/ 100
METRIC RATING
8th/ 347
METRIC RANK
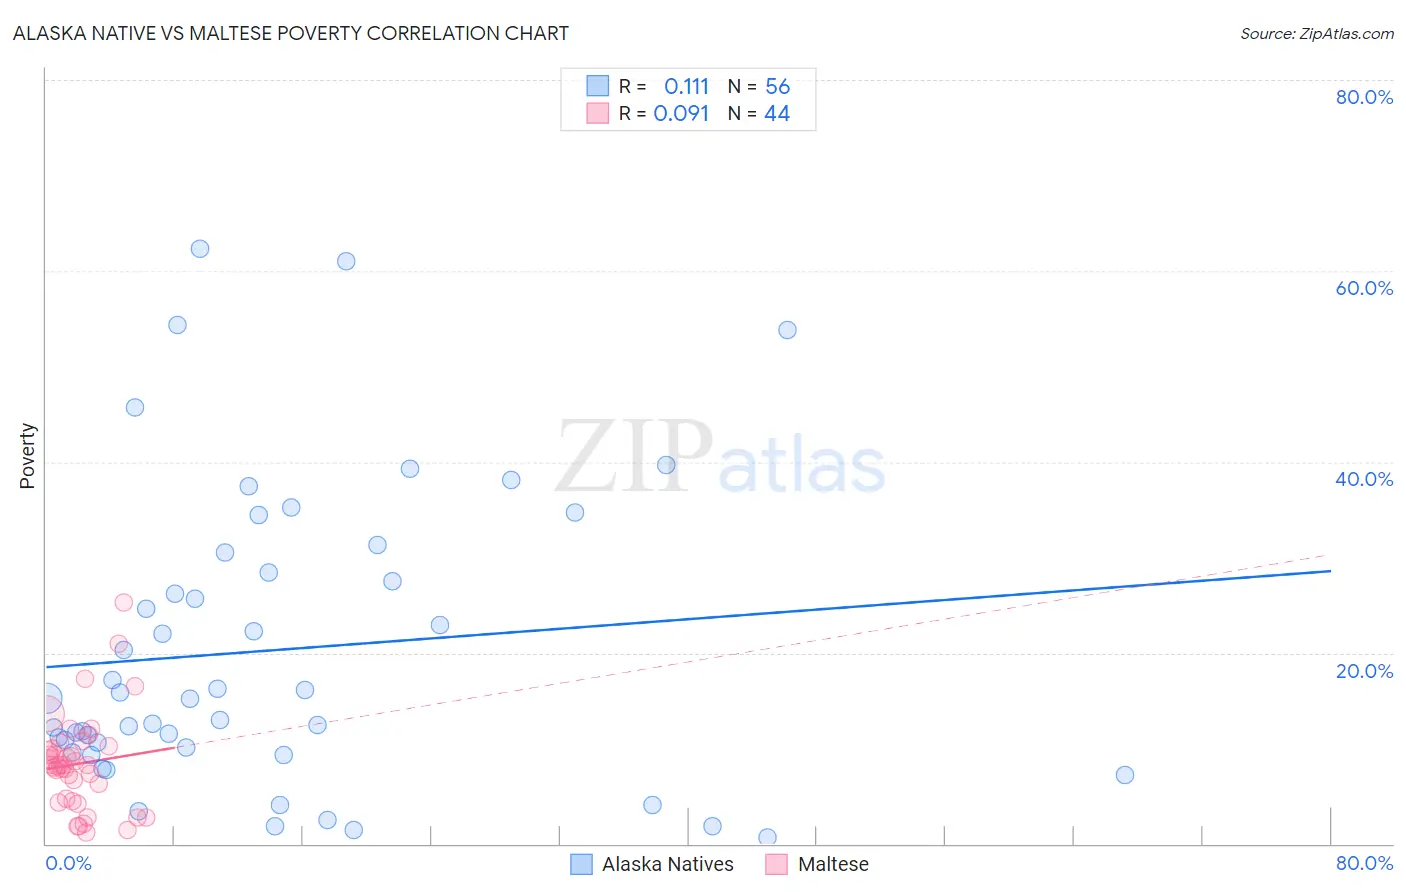
Alaska Native vs Maltese Poverty Correlation Chart
The statistical analysis conducted on geographies consisting of 76,760,249 people shows a poor positive correlation between the proportion of Alaska Natives and poverty level in the United States with a correlation coefficient (R) of 0.111 and weighted average of 13.5%. Similarly, the statistical analysis conducted on geographies consisting of 126,440,716 people shows a slight positive correlation between the proportion of Maltese and poverty level in the United States with a correlation coefficient (R) of 0.091 and weighted average of 10.2%, a difference of 32.6%.
Poverty Correlation Summary
| Measurement | Alaska Native | Maltese |
| Minimum | 0.63% | 1.2% |
| Maximum | 62.3% | 25.2% |
| Range | 61.6% | 24.1% |
| Mean | 20.3% | 8.4% |
| Median | 15.2% | 8.2% |
| Interquartile 25% (IQ1) | 9.8% | 4.6% |
| Interquartile 75% (IQ3) | 29.5% | 10.1% |
| Interquartile Range (IQR) | 19.7% | 5.5% |
| Standard Deviation (Sample) | 15.5% | 5.0% |
| Standard Deviation (Population) | 15.4% | 4.9% |
Similar Demographics by Poverty
Demographics Similar to Alaska Natives by Poverty
In terms of poverty, the demographic groups most similar to Alaska Natives are Marshallese (13.4%, a difference of 0.15%), German Russian (13.4%, a difference of 0.16%), Immigrants from Eritrea (13.4%, a difference of 0.38%), Immigrants from Nigeria (13.5%, a difference of 0.45%), and Immigrants from Africa (13.4%, a difference of 0.48%).
| Demographics | Rating | Rank | Poverty |
| Americans | 2.9 /100 | #220 | Tragic 13.4% |
| Alsatians | 2.6 /100 | #221 | Tragic 13.4% |
| Immigrants | Micronesia | 2.6 /100 | #222 | Tragic 13.4% |
| Immigrants | Africa | 2.5 /100 | #223 | Tragic 13.4% |
| Immigrants | Eritrea | 2.4 /100 | #224 | Tragic 13.4% |
| German Russians | 2.2 /100 | #225 | Tragic 13.4% |
| Marshallese | 2.2 /100 | #226 | Tragic 13.4% |
| Alaska Natives | 2.1 /100 | #227 | Tragic 13.5% |
| Immigrants | Nigeria | 1.7 /100 | #228 | Tragic 13.5% |
| Osage | 1.5 /100 | #229 | Tragic 13.6% |
| Alaskan Athabascans | 1.5 /100 | #230 | Tragic 13.6% |
| Nigerians | 1.4 /100 | #231 | Tragic 13.6% |
| Fijians | 0.8 /100 | #232 | Tragic 13.7% |
| Immigrants | Saudi Arabia | 0.8 /100 | #233 | Tragic 13.8% |
| Immigrants | Laos | 0.7 /100 | #234 | Tragic 13.8% |
Demographics Similar to Maltese by Poverty
In terms of poverty, the demographic groups most similar to Maltese are Filipino (10.1%, a difference of 0.42%), Immigrants from South Central Asia (10.2%, a difference of 0.45%), Assyrian/Chaldean/Syriac (10.1%, a difference of 0.56%), Immigrants from Ireland (10.1%, a difference of 0.74%), and Bulgarian (10.2%, a difference of 0.86%).
| Demographics | Rating | Rank | Poverty |
| Immigrants | India | 100.0 /100 | #1 | Exceptional 9.0% |
| Chinese | 100.0 /100 | #2 | Exceptional 9.5% |
| Thais | 100.0 /100 | #3 | Exceptional 9.6% |
| Immigrants | Taiwan | 100.0 /100 | #4 | Exceptional 9.7% |
| Immigrants | Ireland | 99.9 /100 | #5 | Exceptional 10.1% |
| Assyrians/Chaldeans/Syriacs | 99.9 /100 | #6 | Exceptional 10.1% |
| Filipinos | 99.9 /100 | #7 | Exceptional 10.1% |
| Maltese | 99.9 /100 | #8 | Exceptional 10.2% |
| Immigrants | South Central Asia | 99.9 /100 | #9 | Exceptional 10.2% |
| Bulgarians | 99.9 /100 | #10 | Exceptional 10.2% |
| Immigrants | Lithuania | 99.9 /100 | #11 | Exceptional 10.3% |
| Bhutanese | 99.8 /100 | #12 | Exceptional 10.4% |
| Immigrants | Hong Kong | 99.8 /100 | #13 | Exceptional 10.4% |
| Immigrants | Bolivia | 99.8 /100 | #14 | Exceptional 10.4% |
| Bolivians | 99.8 /100 | #15 | Exceptional 10.4% |