Immigrants from Jordan vs Maltese Poverty
COMPARE
Immigrants from Jordan
Maltese
Poverty
Poverty Comparison
Immigrants from Jordan
Maltese
11.9%
POVERTY
82.4/ 100
METRIC RATING
138th/ 347
METRIC RANK
10.2%
POVERTY
99.9/ 100
METRIC RATING
8th/ 347
METRIC RANK
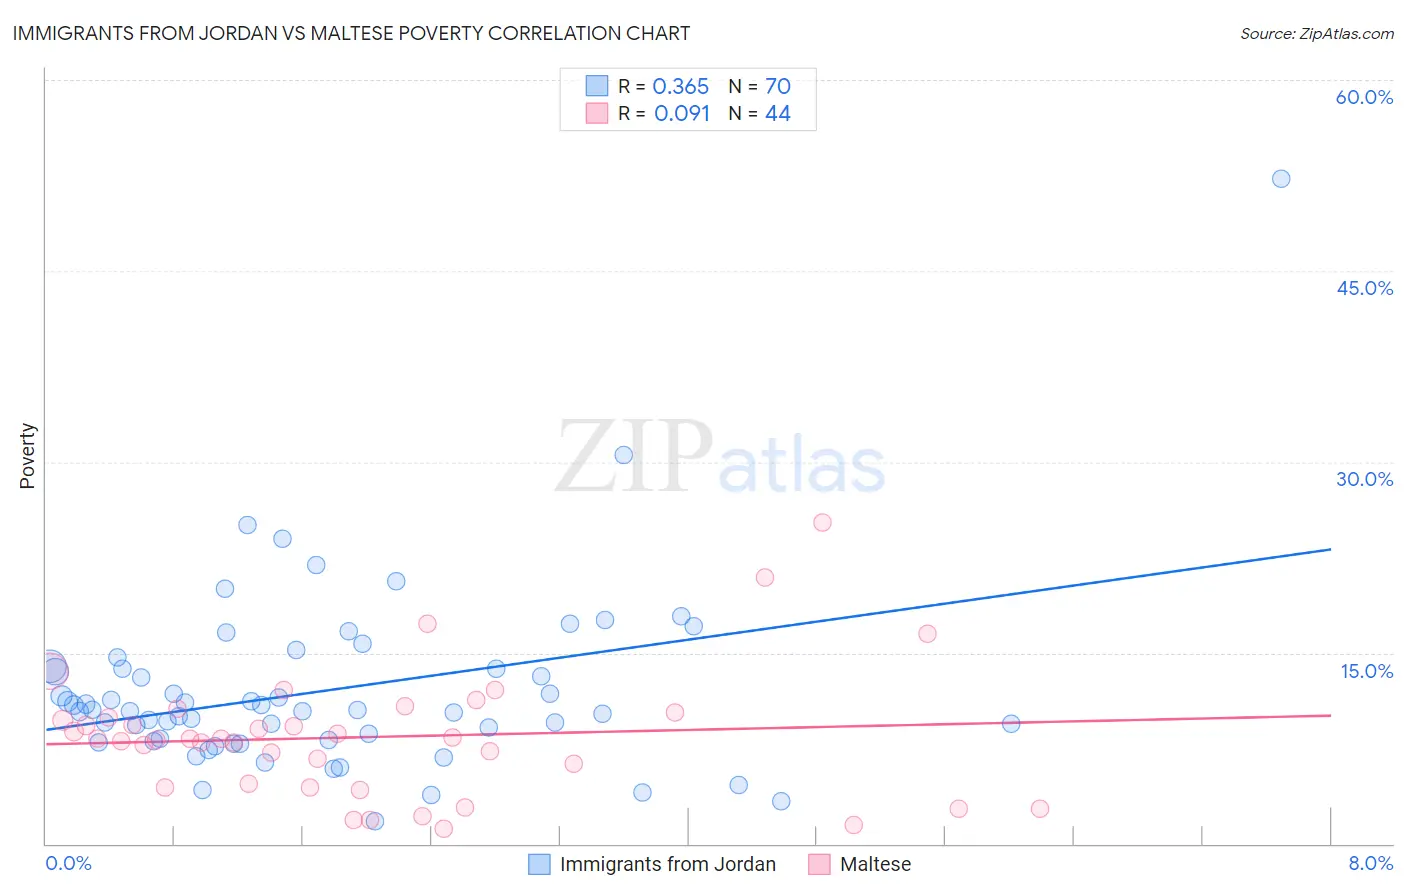
Immigrants from Jordan vs Maltese Poverty Correlation Chart
The statistical analysis conducted on geographies consisting of 181,257,123 people shows a mild positive correlation between the proportion of Immigrants from Jordan and poverty level in the United States with a correlation coefficient (R) of 0.365 and weighted average of 11.9%. Similarly, the statistical analysis conducted on geographies consisting of 126,440,716 people shows a slight positive correlation between the proportion of Maltese and poverty level in the United States with a correlation coefficient (R) of 0.091 and weighted average of 10.2%, a difference of 16.7%.
Poverty Correlation Summary
| Measurement | Immigrants from Jordan | Maltese |
| Minimum | 1.8% | 1.2% |
| Maximum | 52.2% | 25.2% |
| Range | 50.4% | 24.1% |
| Mean | 12.0% | 8.4% |
| Median | 10.5% | 8.2% |
| Interquartile 25% (IQ1) | 8.1% | 4.6% |
| Interquartile 75% (IQ3) | 13.8% | 10.1% |
| Interquartile Range (IQR) | 5.6% | 5.5% |
| Standard Deviation (Sample) | 7.2% | 5.0% |
| Standard Deviation (Population) | 7.1% | 4.9% |
Similar Demographics by Poverty
Demographics Similar to Immigrants from Jordan by Poverty
In terms of poverty, the demographic groups most similar to Immigrants from Jordan are Pakistani (11.9%, a difference of 0.030%), Immigrants from Switzerland (11.8%, a difference of 0.11%), Immigrants from Peru (11.9%, a difference of 0.22%), Immigrants from France (11.9%, a difference of 0.31%), and Chilean (11.8%, a difference of 0.32%).
| Demographics | Rating | Rank | Poverty |
| French | 86.1 /100 | #131 | Excellent 11.8% |
| Peruvians | 85.6 /100 | #132 | Excellent 11.8% |
| Immigrants | Western Europe | 85.2 /100 | #133 | Excellent 11.8% |
| Yugoslavians | 85.2 /100 | #134 | Excellent 11.8% |
| Immigrants | Vietnam | 85.2 /100 | #135 | Excellent 11.8% |
| Chileans | 84.2 /100 | #136 | Excellent 11.8% |
| Immigrants | Switzerland | 83.0 /100 | #137 | Excellent 11.8% |
| Immigrants | Jordan | 82.4 /100 | #138 | Excellent 11.9% |
| Pakistanis | 82.2 /100 | #139 | Excellent 11.9% |
| Immigrants | Peru | 81.1 /100 | #140 | Excellent 11.9% |
| Immigrants | France | 80.5 /100 | #141 | Excellent 11.9% |
| Basques | 80.4 /100 | #142 | Excellent 11.9% |
| Brazilians | 79.7 /100 | #143 | Good 11.9% |
| Icelanders | 77.9 /100 | #144 | Good 11.9% |
| Syrians | 75.1 /100 | #145 | Good 12.0% |
Demographics Similar to Maltese by Poverty
In terms of poverty, the demographic groups most similar to Maltese are Filipino (10.1%, a difference of 0.42%), Immigrants from South Central Asia (10.2%, a difference of 0.45%), Assyrian/Chaldean/Syriac (10.1%, a difference of 0.56%), Immigrants from Ireland (10.1%, a difference of 0.74%), and Bulgarian (10.2%, a difference of 0.86%).
| Demographics | Rating | Rank | Poverty |
| Immigrants | India | 100.0 /100 | #1 | Exceptional 9.0% |
| Chinese | 100.0 /100 | #2 | Exceptional 9.5% |
| Thais | 100.0 /100 | #3 | Exceptional 9.6% |
| Immigrants | Taiwan | 100.0 /100 | #4 | Exceptional 9.7% |
| Immigrants | Ireland | 99.9 /100 | #5 | Exceptional 10.1% |
| Assyrians/Chaldeans/Syriacs | 99.9 /100 | #6 | Exceptional 10.1% |
| Filipinos | 99.9 /100 | #7 | Exceptional 10.1% |
| Maltese | 99.9 /100 | #8 | Exceptional 10.2% |
| Immigrants | South Central Asia | 99.9 /100 | #9 | Exceptional 10.2% |
| Bulgarians | 99.9 /100 | #10 | Exceptional 10.2% |
| Immigrants | Lithuania | 99.9 /100 | #11 | Exceptional 10.3% |
| Bhutanese | 99.8 /100 | #12 | Exceptional 10.4% |
| Immigrants | Hong Kong | 99.8 /100 | #13 | Exceptional 10.4% |
| Immigrants | Bolivia | 99.8 /100 | #14 | Exceptional 10.4% |
| Bolivians | 99.8 /100 | #15 | Exceptional 10.4% |