Native/Alaskan vs Immigrants from Armenia Seniors Poverty Over the Age of 65
COMPARE
Native/Alaskan
Immigrants from Armenia
Seniors Poverty Over the Age of 65
Seniors Poverty Over the Age of 65 Comparison
Natives/Alaskans
Immigrants from Armenia
14.2%
SENIORS POVERTY OVER THE AGE OF 65
0.0/ 100
METRIC RATING
311th/ 347
METRIC RANK
15.2%
SENIORS POVERTY OVER THE AGE OF 65
0.0/ 100
METRIC RATING
326th/ 347
METRIC RANK
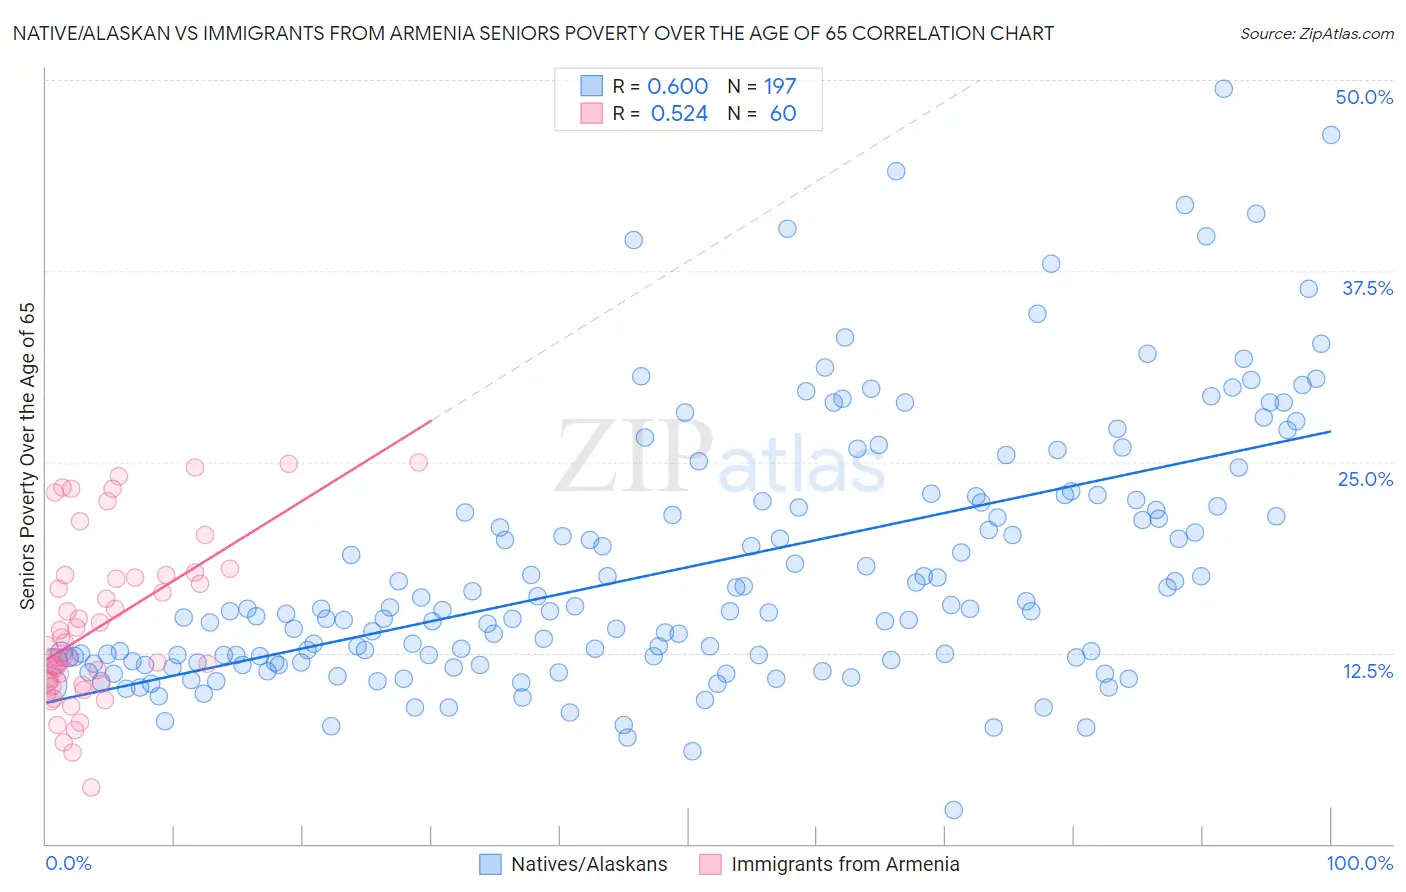
Native/Alaskan vs Immigrants from Armenia Seniors Poverty Over the Age of 65 Correlation Chart
The statistical analysis conducted on geographies consisting of 510,101,075 people shows a substantial positive correlation between the proportion of Natives/Alaskans and poverty level among seniors over the age of 65 in the United States with a correlation coefficient (R) of 0.600 and weighted average of 14.2%. Similarly, the statistical analysis conducted on geographies consisting of 97,583,648 people shows a substantial positive correlation between the proportion of Immigrants from Armenia and poverty level among seniors over the age of 65 in the United States with a correlation coefficient (R) of 0.524 and weighted average of 15.2%, a difference of 6.6%.
Seniors Poverty Over the Age of 65 Correlation Summary
| Measurement | Native/Alaskan | Immigrants from Armenia |
| Minimum | 2.2% | 3.6% |
| Maximum | 49.4% | 25.0% |
| Range | 47.2% | 21.4% |
| Mean | 18.1% | 14.3% |
| Median | 15.2% | 12.5% |
| Interquartile 25% (IQ1) | 11.9% | 10.5% |
| Interquartile 75% (IQ3) | 22.3% | 17.5% |
| Interquartile Range (IQR) | 10.4% | 7.0% |
| Standard Deviation (Sample) | 8.6% | 5.3% |
| Standard Deviation (Population) | 8.6% | 5.3% |
Demographics Similar to Natives/Alaskans and Immigrants from Armenia by Seniors Poverty Over the Age of 65
In terms of seniors poverty over the age of 65, the demographic groups most similar to Natives/Alaskans are Bahamian (14.2%, a difference of 0.010%), Honduran (14.2%, a difference of 0.27%), Trinidadian and Tobagonian (14.2%, a difference of 0.36%), Hispanic or Latino (14.3%, a difference of 0.54%), and Barbadian (14.4%, a difference of 0.91%). Similarly, the demographic groups most similar to Immigrants from Armenia are Crow (15.2%, a difference of 0.25%), Central American Indian (15.1%, a difference of 0.60%), Sioux (15.3%, a difference of 0.79%), Nicaraguan (15.0%, a difference of 1.2%), and Yakama (14.8%, a difference of 2.6%).
| Demographics | Rating | Rank | Seniors Poverty Over the Age of 65 |
| Trinidadians and Tobagonians | 0.0 /100 | #308 | Tragic 14.2% |
| Hondurans | 0.0 /100 | #309 | Tragic 14.2% |
| Bahamians | 0.0 /100 | #310 | Tragic 14.2% |
| Natives/Alaskans | 0.0 /100 | #311 | Tragic 14.2% |
| Hispanics or Latinos | 0.0 /100 | #312 | Tragic 14.3% |
| Barbadians | 0.0 /100 | #313 | Tragic 14.4% |
| Guyanese | 0.0 /100 | #314 | Tragic 14.4% |
| Immigrants | Ecuador | 0.0 /100 | #315 | Tragic 14.4% |
| Immigrants | Guyana | 0.0 /100 | #316 | Tragic 14.5% |
| Haitians | 0.0 /100 | #317 | Tragic 14.5% |
| Immigrants | Honduras | 0.0 /100 | #318 | Tragic 14.5% |
| Cape Verdeans | 0.0 /100 | #319 | Tragic 14.7% |
| Immigrants | Haiti | 0.0 /100 | #320 | Tragic 14.7% |
| Houma | 0.0 /100 | #321 | Tragic 14.7% |
| Immigrants | Barbados | 0.0 /100 | #322 | Tragic 14.8% |
| Yakama | 0.0 /100 | #323 | Tragic 14.8% |
| Nicaraguans | 0.0 /100 | #324 | Tragic 15.0% |
| Central American Indians | 0.0 /100 | #325 | Tragic 15.1% |
| Immigrants | Armenia | 0.0 /100 | #326 | Tragic 15.2% |
| Crow | 0.0 /100 | #327 | Tragic 15.2% |
| Sioux | 0.0 /100 | #328 | Tragic 15.3% |