Native Hawaiian vs Immigrants from West Indies Poverty
COMPARE
Native Hawaiian
Immigrants from West Indies
Poverty
Poverty Comparison
Native Hawaiians
Immigrants from West Indies
11.6%
POVERTY
92.1/ 100
METRIC RATING
104th/ 347
METRIC RANK
14.8%
POVERTY
0.0/ 100
METRIC RATING
275th/ 347
METRIC RANK
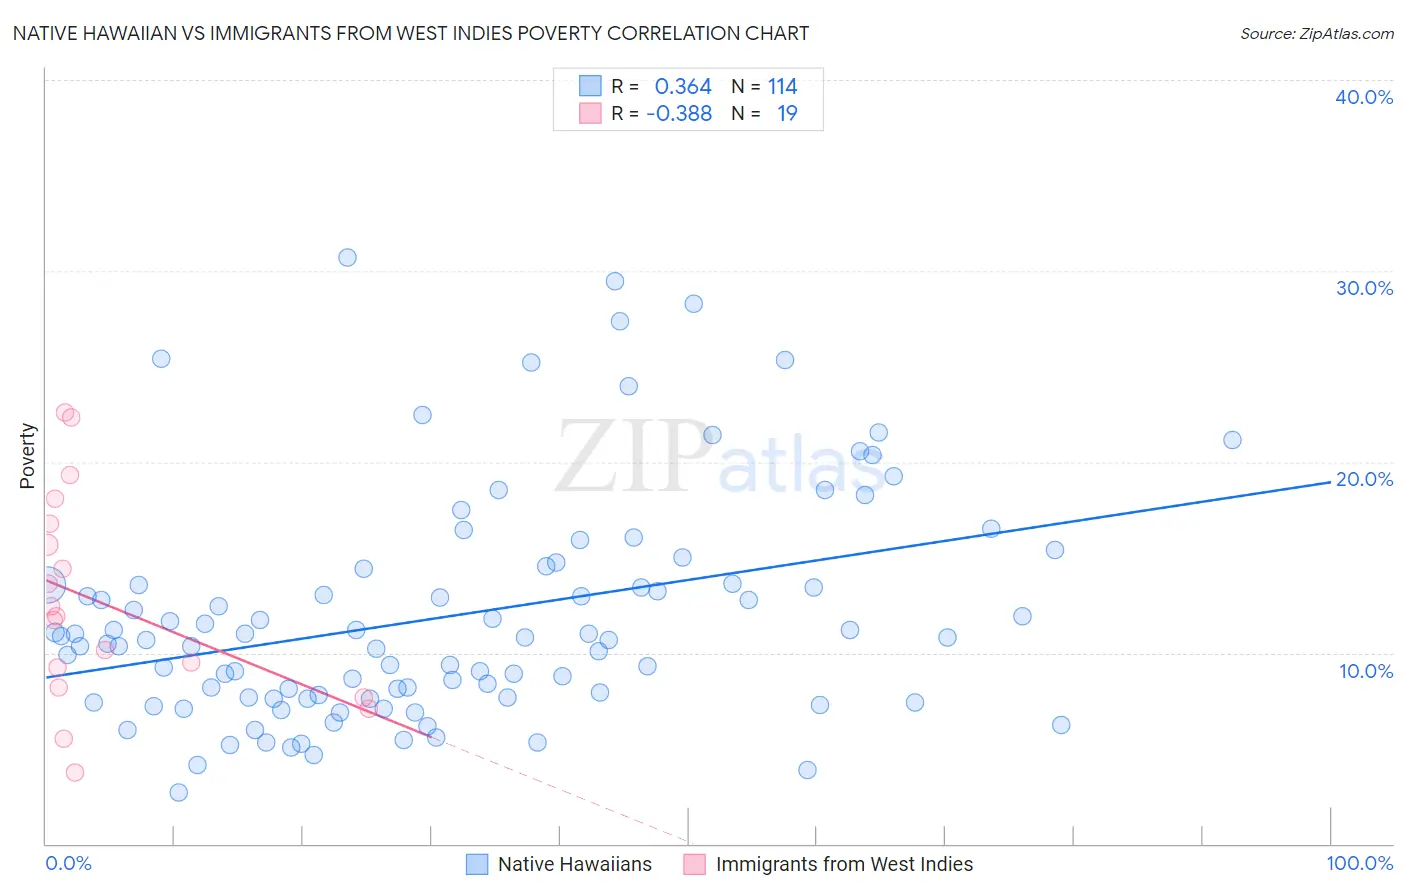
Native Hawaiian vs Immigrants from West Indies Poverty Correlation Chart
The statistical analysis conducted on geographies consisting of 331,880,799 people shows a mild positive correlation between the proportion of Native Hawaiians and poverty level in the United States with a correlation coefficient (R) of 0.364 and weighted average of 11.6%. Similarly, the statistical analysis conducted on geographies consisting of 72,454,628 people shows a mild negative correlation between the proportion of Immigrants from West Indies and poverty level in the United States with a correlation coefficient (R) of -0.388 and weighted average of 14.8%, a difference of 27.9%.
Poverty Correlation Summary
| Measurement | Native Hawaiian | Immigrants from West Indies |
| Minimum | 2.7% | 3.7% |
| Maximum | 30.7% | 22.6% |
| Range | 28.0% | 18.9% |
| Mean | 11.9% | 12.6% |
| Median | 10.7% | 11.9% |
| Interquartile 25% (IQ1) | 7.6% | 8.2% |
| Interquartile 75% (IQ3) | 13.6% | 16.8% |
| Interquartile Range (IQR) | 6.0% | 8.6% |
| Standard Deviation (Sample) | 5.9% | 5.4% |
| Standard Deviation (Population) | 5.9% | 5.3% |
Similar Demographics by Poverty
Demographics Similar to Native Hawaiians by Poverty
In terms of poverty, the demographic groups most similar to Native Hawaiians are Portuguese (11.6%, a difference of 0.020%), Immigrants from Zimbabwe (11.6%, a difference of 0.020%), Laotian (11.6%, a difference of 0.11%), Okinawan (11.6%, a difference of 0.11%), and Palestinian (11.6%, a difference of 0.11%).
| Demographics | Rating | Rank | Poverty |
| Immigrants | Egypt | 94.6 /100 | #97 | Exceptional 11.5% |
| Immigrants | Latvia | 94.5 /100 | #98 | Exceptional 11.5% |
| Immigrants | Indonesia | 94.2 /100 | #99 | Exceptional 11.5% |
| Scottish | 94.0 /100 | #100 | Exceptional 11.5% |
| Slavs | 93.3 /100 | #101 | Exceptional 11.5% |
| Laotians | 92.4 /100 | #102 | Exceptional 11.6% |
| Okinawans | 92.4 /100 | #103 | Exceptional 11.6% |
| Native Hawaiians | 92.1 /100 | #104 | Exceptional 11.6% |
| Portuguese | 92.1 /100 | #105 | Exceptional 11.6% |
| Immigrants | Zimbabwe | 92.1 /100 | #106 | Exceptional 11.6% |
| Palestinians | 91.8 /100 | #107 | Exceptional 11.6% |
| Canadians | 91.7 /100 | #108 | Exceptional 11.6% |
| Immigrants | Turkey | 91.7 /100 | #109 | Exceptional 11.6% |
| Welsh | 91.6 /100 | #110 | Exceptional 11.6% |
| French Canadians | 91.0 /100 | #111 | Exceptional 11.6% |
Demographics Similar to Immigrants from West Indies by Poverty
In terms of poverty, the demographic groups most similar to Immigrants from West Indies are Immigrants from Bahamas (14.8%, a difference of 0.0%), Barbadian (14.8%, a difference of 0.040%), Bangladeshi (14.8%, a difference of 0.060%), Belizean (14.8%, a difference of 0.080%), and Immigrants from St. Vincent and the Grenadines (14.9%, a difference of 0.37%).
| Demographics | Rating | Rank | Poverty |
| Sub-Saharan Africans | 0.1 /100 | #268 | Tragic 14.5% |
| Immigrants | Cuba | 0.1 /100 | #269 | Tragic 14.6% |
| Central Americans | 0.1 /100 | #270 | Tragic 14.6% |
| Shoshone | 0.0 /100 | #271 | Tragic 14.7% |
| Chickasaw | 0.0 /100 | #272 | Tragic 14.7% |
| Spanish Americans | 0.0 /100 | #273 | Tragic 14.7% |
| Barbadians | 0.0 /100 | #274 | Tragic 14.8% |
| Immigrants | West Indies | 0.0 /100 | #275 | Tragic 14.8% |
| Immigrants | Bahamas | 0.0 /100 | #276 | Tragic 14.8% |
| Bangladeshis | 0.0 /100 | #277 | Tragic 14.8% |
| Belizeans | 0.0 /100 | #278 | Tragic 14.8% |
| Immigrants | St. Vincent and the Grenadines | 0.0 /100 | #279 | Tragic 14.9% |
| Haitians | 0.0 /100 | #280 | Tragic 14.9% |
| Immigrants | Barbados | 0.0 /100 | #281 | Tragic 14.9% |
| Comanche | 0.0 /100 | #282 | Tragic 15.0% |