Native Hawaiian vs West Indian Seniors Poverty Over the Age of 65
COMPARE
Native Hawaiian
West Indian
Seniors Poverty Over the Age of 65
Seniors Poverty Over the Age of 65 Comparison
Native Hawaiians
West Indians
9.4%
SENIORS POVERTY OVER THE AGE OF 65
99.8/ 100
METRIC RATING
33rd/ 347
METRIC RANK
14.1%
SENIORS POVERTY OVER THE AGE OF 65
0.0/ 100
METRIC RATING
304th/ 347
METRIC RANK
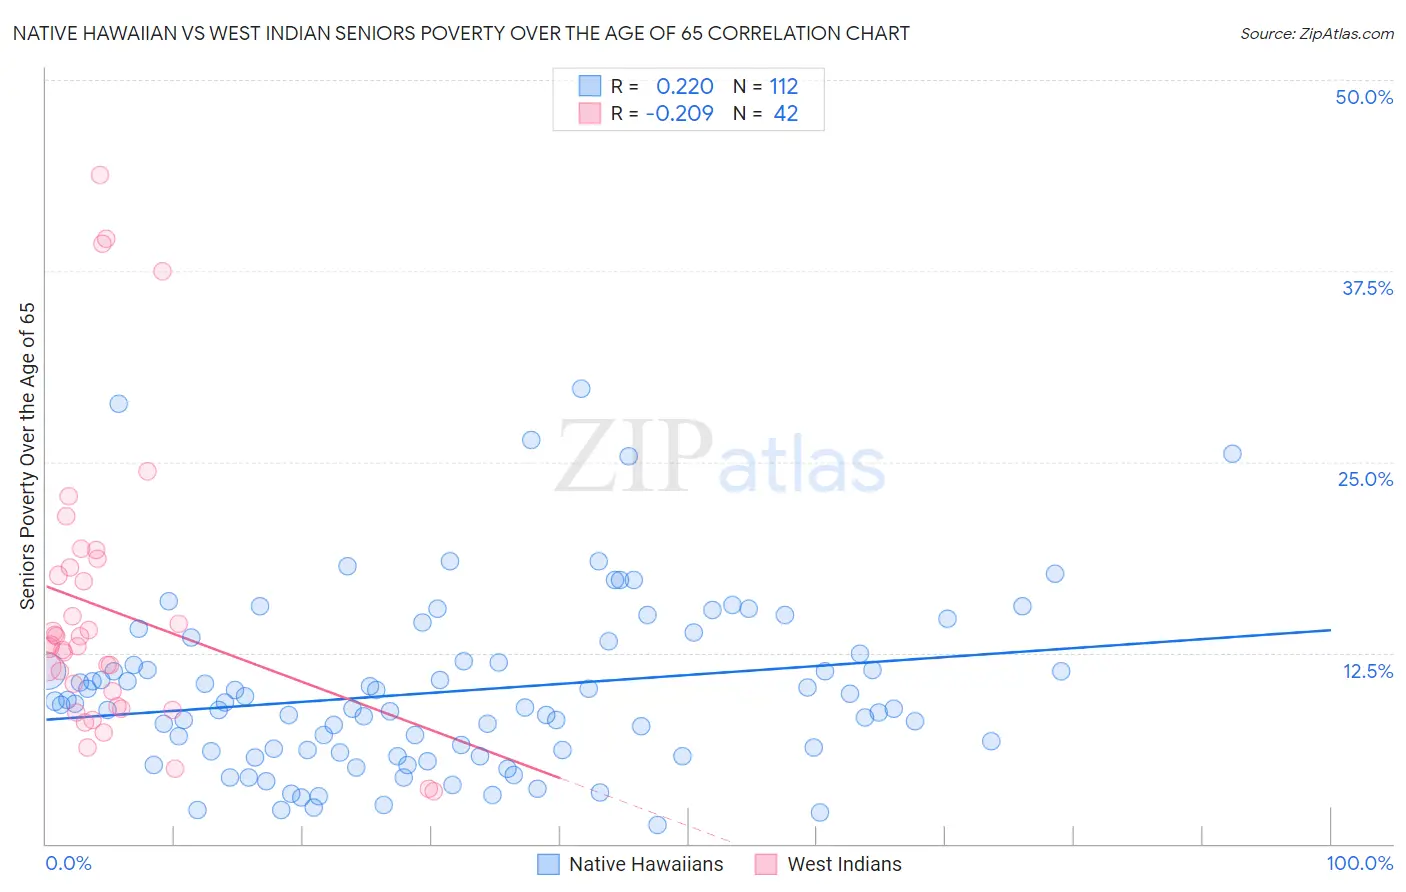
Native Hawaiian vs West Indian Seniors Poverty Over the Age of 65 Correlation Chart
The statistical analysis conducted on geographies consisting of 330,714,575 people shows a weak positive correlation between the proportion of Native Hawaiians and poverty level among seniors over the age of 65 in the United States with a correlation coefficient (R) of 0.220 and weighted average of 9.4%. Similarly, the statistical analysis conducted on geographies consisting of 253,356,743 people shows a weak negative correlation between the proportion of West Indians and poverty level among seniors over the age of 65 in the United States with a correlation coefficient (R) of -0.209 and weighted average of 14.1%, a difference of 49.9%.
Seniors Poverty Over the Age of 65 Correlation Summary
| Measurement | Native Hawaiian | West Indian |
| Minimum | 1.2% | 3.4% |
| Maximum | 29.8% | 43.8% |
| Range | 28.6% | 40.3% |
| Mean | 10.0% | 15.3% |
| Median | 9.0% | 13.0% |
| Interquartile 25% (IQ1) | 6.0% | 9.0% |
| Interquartile 75% (IQ3) | 12.2% | 18.1% |
| Interquartile Range (IQR) | 6.1% | 9.1% |
| Standard Deviation (Sample) | 5.7% | 9.5% |
| Standard Deviation (Population) | 5.6% | 9.3% |
Similar Demographics by Seniors Poverty Over the Age of 65
Demographics Similar to Native Hawaiians by Seniors Poverty Over the Age of 65
In terms of seniors poverty over the age of 65, the demographic groups most similar to Native Hawaiians are Northern European (9.4%, a difference of 0.020%), British (9.4%, a difference of 0.10%), Finnish (9.4%, a difference of 0.30%), Latvian (9.5%, a difference of 0.48%), and Menominee (9.4%, a difference of 0.52%).
| Demographics | Rating | Rank | Seniors Poverty Over the Age of 65 |
| Immigrants | Scotland | 99.9 /100 | #26 | Exceptional 9.3% |
| Italians | 99.9 /100 | #27 | Exceptional 9.3% |
| Tongans | 99.9 /100 | #28 | Exceptional 9.3% |
| Bhutanese | 99.9 /100 | #29 | Exceptional 9.3% |
| Menominee | 99.8 /100 | #30 | Exceptional 9.4% |
| Finns | 99.8 /100 | #31 | Exceptional 9.4% |
| Northern Europeans | 99.8 /100 | #32 | Exceptional 9.4% |
| Native Hawaiians | 99.8 /100 | #33 | Exceptional 9.4% |
| British | 99.8 /100 | #34 | Exceptional 9.4% |
| Latvians | 99.8 /100 | #35 | Exceptional 9.5% |
| Czechoslovakians | 99.8 /100 | #36 | Exceptional 9.5% |
| Scotch-Irish | 99.7 /100 | #37 | Exceptional 9.5% |
| Belgians | 99.7 /100 | #38 | Exceptional 9.5% |
| Greeks | 99.6 /100 | #39 | Exceptional 9.6% |
| Assyrians/Chaldeans/Syriacs | 99.6 /100 | #40 | Exceptional 9.6% |
Demographics Similar to West Indians by Seniors Poverty Over the Age of 65
In terms of seniors poverty over the age of 65, the demographic groups most similar to West Indians are Immigrants from Trinidad and Tobago (14.1%, a difference of 0.060%), Immigrants from Bangladesh (14.1%, a difference of 0.24%), Yup'ik (14.1%, a difference of 0.35%), Immigrants from Latin America (14.2%, a difference of 0.36%), and U.S. Virgin Islander (14.0%, a difference of 0.43%).
| Demographics | Rating | Rank | Seniors Poverty Over the Age of 65 |
| Vietnamese | 0.0 /100 | #297 | Tragic 14.0% |
| Immigrants | Belize | 0.0 /100 | #298 | Tragic 14.0% |
| Ecuadorians | 0.0 /100 | #299 | Tragic 14.0% |
| Immigrants | Uzbekistan | 0.0 /100 | #300 | Tragic 14.0% |
| U.S. Virgin Islanders | 0.0 /100 | #301 | Tragic 14.0% |
| Yup'ik | 0.0 /100 | #302 | Tragic 14.1% |
| Immigrants | Bangladesh | 0.0 /100 | #303 | Tragic 14.1% |
| West Indians | 0.0 /100 | #304 | Tragic 14.1% |
| Immigrants | Trinidad and Tobago | 0.0 /100 | #305 | Tragic 14.1% |
| Immigrants | Latin America | 0.0 /100 | #306 | Tragic 14.2% |
| Immigrants | West Indies | 0.0 /100 | #307 | Tragic 14.2% |
| Trinidadians and Tobagonians | 0.0 /100 | #308 | Tragic 14.2% |
| Hondurans | 0.0 /100 | #309 | Tragic 14.2% |
| Bahamians | 0.0 /100 | #310 | Tragic 14.2% |
| Natives/Alaskans | 0.0 /100 | #311 | Tragic 14.2% |