Native Hawaiian vs Immigrants from Iran Poverty
COMPARE
Native Hawaiian
Immigrants from Iran
Poverty
Poverty Comparison
Native Hawaiians
Immigrants from Iran
11.6%
POVERTY
92.1/ 100
METRIC RATING
104th/ 347
METRIC RANK
10.9%
POVERTY
99.2/ 100
METRIC RATING
41st/ 347
METRIC RANK
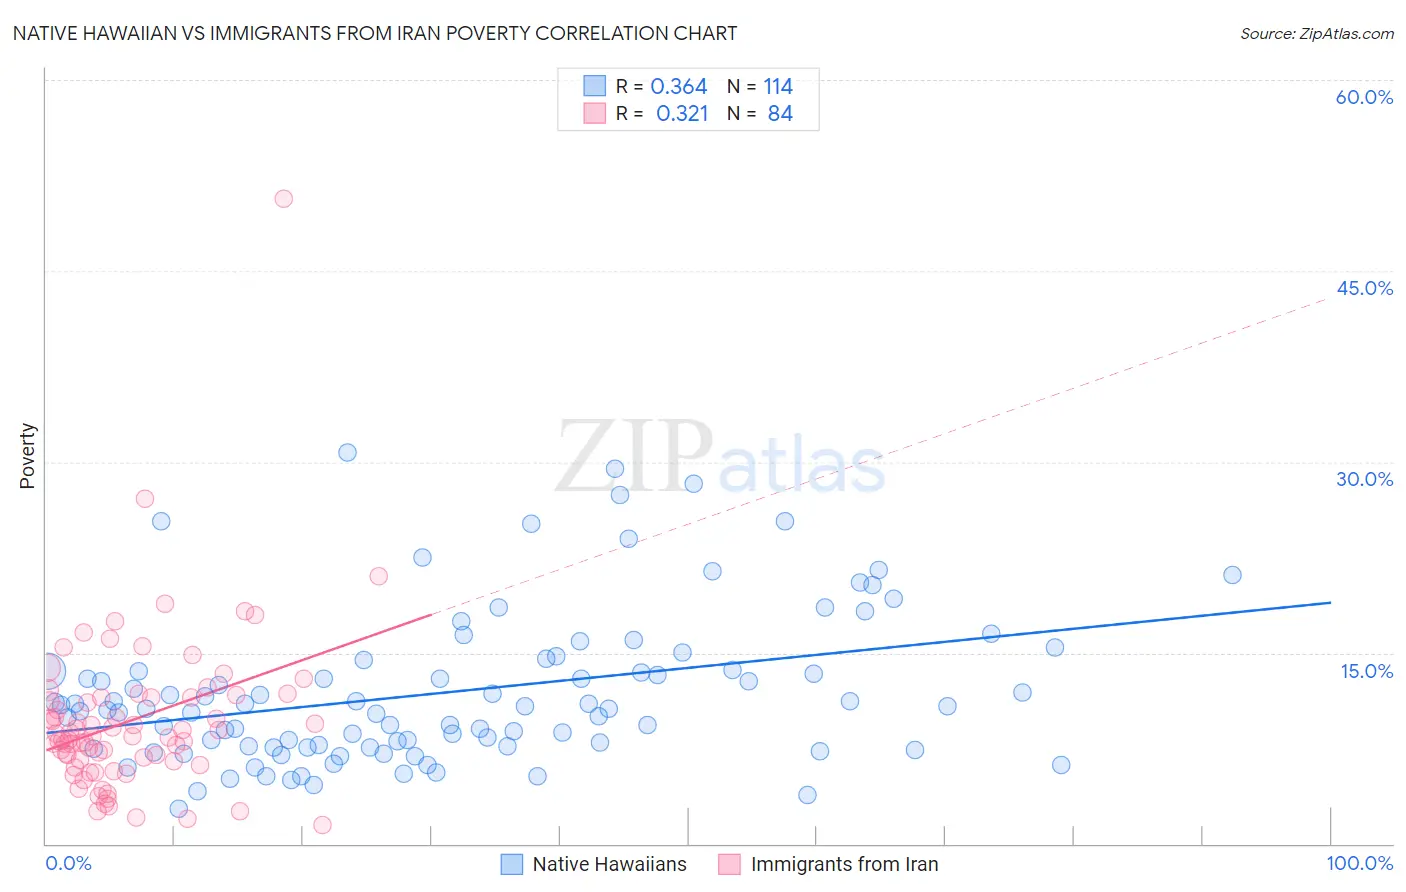
Native Hawaiian vs Immigrants from Iran Poverty Correlation Chart
The statistical analysis conducted on geographies consisting of 331,880,799 people shows a mild positive correlation between the proportion of Native Hawaiians and poverty level in the United States with a correlation coefficient (R) of 0.364 and weighted average of 11.6%. Similarly, the statistical analysis conducted on geographies consisting of 279,844,732 people shows a mild positive correlation between the proportion of Immigrants from Iran and poverty level in the United States with a correlation coefficient (R) of 0.321 and weighted average of 10.9%, a difference of 6.6%.
Poverty Correlation Summary
| Measurement | Native Hawaiian | Immigrants from Iran |
| Minimum | 2.7% | 1.5% |
| Maximum | 30.7% | 50.6% |
| Range | 28.0% | 49.1% |
| Mean | 11.9% | 9.7% |
| Median | 10.7% | 8.4% |
| Interquartile 25% (IQ1) | 7.6% | 6.5% |
| Interquartile 75% (IQ3) | 13.6% | 11.5% |
| Interquartile Range (IQR) | 6.0% | 5.0% |
| Standard Deviation (Sample) | 5.9% | 6.4% |
| Standard Deviation (Population) | 5.9% | 6.4% |
Similar Demographics by Poverty
Demographics Similar to Native Hawaiians by Poverty
In terms of poverty, the demographic groups most similar to Native Hawaiians are Portuguese (11.6%, a difference of 0.020%), Immigrants from Zimbabwe (11.6%, a difference of 0.020%), Laotian (11.6%, a difference of 0.11%), Okinawan (11.6%, a difference of 0.11%), and Palestinian (11.6%, a difference of 0.11%).
| Demographics | Rating | Rank | Poverty |
| Immigrants | Egypt | 94.6 /100 | #97 | Exceptional 11.5% |
| Immigrants | Latvia | 94.5 /100 | #98 | Exceptional 11.5% |
| Immigrants | Indonesia | 94.2 /100 | #99 | Exceptional 11.5% |
| Scottish | 94.0 /100 | #100 | Exceptional 11.5% |
| Slavs | 93.3 /100 | #101 | Exceptional 11.5% |
| Laotians | 92.4 /100 | #102 | Exceptional 11.6% |
| Okinawans | 92.4 /100 | #103 | Exceptional 11.6% |
| Native Hawaiians | 92.1 /100 | #104 | Exceptional 11.6% |
| Portuguese | 92.1 /100 | #105 | Exceptional 11.6% |
| Immigrants | Zimbabwe | 92.1 /100 | #106 | Exceptional 11.6% |
| Palestinians | 91.8 /100 | #107 | Exceptional 11.6% |
| Canadians | 91.7 /100 | #108 | Exceptional 11.6% |
| Immigrants | Turkey | 91.7 /100 | #109 | Exceptional 11.6% |
| Welsh | 91.6 /100 | #110 | Exceptional 11.6% |
| French Canadians | 91.0 /100 | #111 | Exceptional 11.6% |
Demographics Similar to Immigrants from Iran by Poverty
In terms of poverty, the demographic groups most similar to Immigrants from Iran are Russian (10.9%, a difference of 0.090%), Immigrants from Pakistan (10.8%, a difference of 0.14%), Czech (10.8%, a difference of 0.22%), Korean (10.9%, a difference of 0.22%), and Immigrants from Greece (10.8%, a difference of 0.26%).
| Demographics | Rating | Rank | Poverty |
| Immigrants | Poland | 99.4 /100 | #34 | Exceptional 10.8% |
| Tongans | 99.4 /100 | #35 | Exceptional 10.8% |
| Cypriots | 99.3 /100 | #36 | Exceptional 10.8% |
| Immigrants | Greece | 99.3 /100 | #37 | Exceptional 10.8% |
| Czechs | 99.3 /100 | #38 | Exceptional 10.8% |
| Immigrants | Pakistan | 99.3 /100 | #39 | Exceptional 10.8% |
| Russians | 99.3 /100 | #40 | Exceptional 10.9% |
| Immigrants | Iran | 99.2 /100 | #41 | Exceptional 10.9% |
| Koreans | 99.2 /100 | #42 | Exceptional 10.9% |
| Immigrants | Singapore | 99.2 /100 | #43 | Exceptional 10.9% |
| Immigrants | Moldova | 99.1 /100 | #44 | Exceptional 10.9% |
| Turks | 98.9 /100 | #45 | Exceptional 11.0% |
| Immigrants | Czechoslovakia | 98.9 /100 | #46 | Exceptional 11.0% |
| Immigrants | Romania | 98.9 /100 | #47 | Exceptional 11.0% |
| Slovenes | 98.9 /100 | #48 | Exceptional 11.0% |