Native Hawaiian vs Immigrants from Norway Poverty
COMPARE
Native Hawaiian
Immigrants from Norway
Poverty
Poverty Comparison
Native Hawaiians
Immigrants from Norway
11.6%
POVERTY
92.1/ 100
METRIC RATING
104th/ 347
METRIC RANK
11.7%
POVERTY
88.0/ 100
METRIC RATING
126th/ 347
METRIC RANK
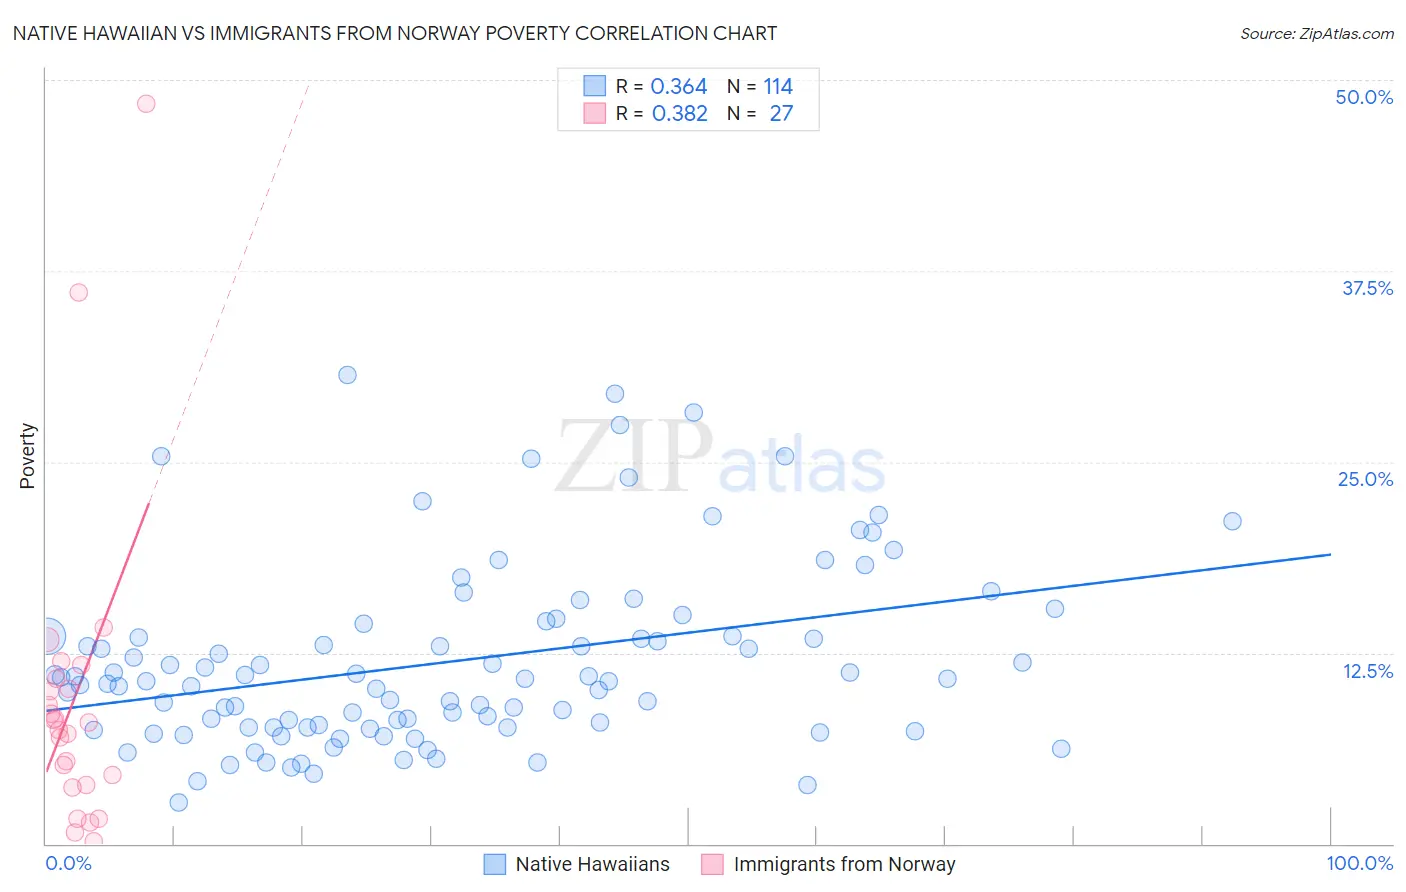
Native Hawaiian vs Immigrants from Norway Poverty Correlation Chart
The statistical analysis conducted on geographies consisting of 331,880,799 people shows a mild positive correlation between the proportion of Native Hawaiians and poverty level in the United States with a correlation coefficient (R) of 0.364 and weighted average of 11.6%. Similarly, the statistical analysis conducted on geographies consisting of 116,687,358 people shows a mild positive correlation between the proportion of Immigrants from Norway and poverty level in the United States with a correlation coefficient (R) of 0.382 and weighted average of 11.7%, a difference of 1.2%.
Poverty Correlation Summary
| Measurement | Native Hawaiian | Immigrants from Norway |
| Minimum | 2.7% | 0.18% |
| Maximum | 30.7% | 48.4% |
| Range | 28.0% | 48.3% |
| Mean | 11.9% | 9.6% |
| Median | 10.7% | 7.9% |
| Interquartile 25% (IQ1) | 7.6% | 3.9% |
| Interquartile 75% (IQ3) | 13.6% | 10.8% |
| Interquartile Range (IQR) | 6.0% | 6.9% |
| Standard Deviation (Sample) | 5.9% | 10.3% |
| Standard Deviation (Population) | 5.9% | 10.1% |
Similar Demographics by Poverty
Demographics Similar to Native Hawaiians by Poverty
In terms of poverty, the demographic groups most similar to Native Hawaiians are Portuguese (11.6%, a difference of 0.020%), Immigrants from Zimbabwe (11.6%, a difference of 0.020%), Laotian (11.6%, a difference of 0.11%), Okinawan (11.6%, a difference of 0.11%), and Palestinian (11.6%, a difference of 0.11%).
| Demographics | Rating | Rank | Poverty |
| Immigrants | Egypt | 94.6 /100 | #97 | Exceptional 11.5% |
| Immigrants | Latvia | 94.5 /100 | #98 | Exceptional 11.5% |
| Immigrants | Indonesia | 94.2 /100 | #99 | Exceptional 11.5% |
| Scottish | 94.0 /100 | #100 | Exceptional 11.5% |
| Slavs | 93.3 /100 | #101 | Exceptional 11.5% |
| Laotians | 92.4 /100 | #102 | Exceptional 11.6% |
| Okinawans | 92.4 /100 | #103 | Exceptional 11.6% |
| Native Hawaiians | 92.1 /100 | #104 | Exceptional 11.6% |
| Portuguese | 92.1 /100 | #105 | Exceptional 11.6% |
| Immigrants | Zimbabwe | 92.1 /100 | #106 | Exceptional 11.6% |
| Palestinians | 91.8 /100 | #107 | Exceptional 11.6% |
| Canadians | 91.7 /100 | #108 | Exceptional 11.6% |
| Immigrants | Turkey | 91.7 /100 | #109 | Exceptional 11.6% |
| Welsh | 91.6 /100 | #110 | Exceptional 11.6% |
| French Canadians | 91.0 /100 | #111 | Exceptional 11.6% |
Demographics Similar to Immigrants from Norway by Poverty
In terms of poverty, the demographic groups most similar to Immigrants from Norway are Immigrants from Argentina (11.7%, a difference of 0.020%), Immigrants from Brazil (11.7%, a difference of 0.040%), Soviet Union (11.7%, a difference of 0.080%), Immigrants from Israel (11.7%, a difference of 0.14%), and Immigrants from Hungary (11.7%, a difference of 0.15%).
| Demographics | Rating | Rank | Poverty |
| Tlingit-Haida | 89.0 /100 | #119 | Excellent 11.7% |
| Immigrants | South Eastern Asia | 88.9 /100 | #120 | Excellent 11.7% |
| New Zealanders | 88.7 /100 | #121 | Excellent 11.7% |
| Puget Sound Salish | 88.7 /100 | #122 | Excellent 11.7% |
| Immigrants | Hungary | 88.6 /100 | #123 | Excellent 11.7% |
| Soviet Union | 88.4 /100 | #124 | Excellent 11.7% |
| Immigrants | Brazil | 88.2 /100 | #125 | Excellent 11.7% |
| Immigrants | Norway | 88.0 /100 | #126 | Excellent 11.7% |
| Immigrants | Argentina | 88.0 /100 | #127 | Excellent 11.7% |
| Immigrants | Israel | 87.4 /100 | #128 | Excellent 11.7% |
| South Africans | 87.0 /100 | #129 | Excellent 11.7% |
| Immigrants | Ukraine | 86.6 /100 | #130 | Excellent 11.8% |
| French | 86.1 /100 | #131 | Excellent 11.8% |
| Peruvians | 85.6 /100 | #132 | Excellent 11.8% |
| Immigrants | Western Europe | 85.2 /100 | #133 | Excellent 11.8% |