Immigrants from Mexico vs Immigrants from West Indies Poverty
COMPARE
Immigrants from Mexico
Immigrants from West Indies
Poverty
Poverty Comparison
Immigrants from Mexico
Immigrants from West Indies
15.5%
POVERTY
0.0/ 100
METRIC RATING
304th/ 347
METRIC RANK
14.8%
POVERTY
0.0/ 100
METRIC RATING
275th/ 347
METRIC RANK
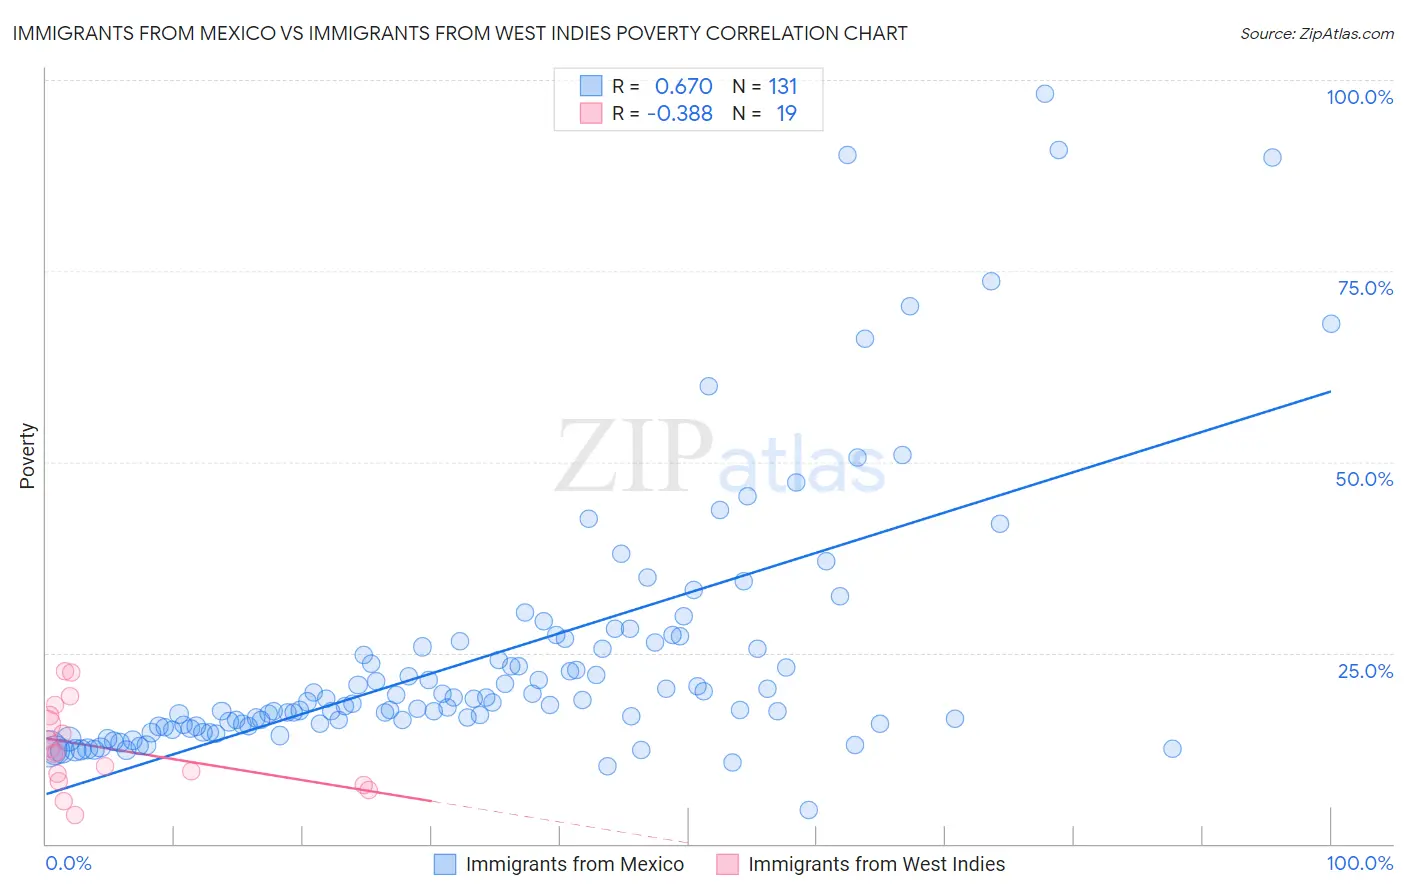
Immigrants from Mexico vs Immigrants from West Indies Poverty Correlation Chart
The statistical analysis conducted on geographies consisting of 513,374,473 people shows a significant positive correlation between the proportion of Immigrants from Mexico and poverty level in the United States with a correlation coefficient (R) of 0.670 and weighted average of 15.5%. Similarly, the statistical analysis conducted on geographies consisting of 72,454,628 people shows a mild negative correlation between the proportion of Immigrants from West Indies and poverty level in the United States with a correlation coefficient (R) of -0.388 and weighted average of 14.8%, a difference of 4.7%.
Poverty Correlation Summary
| Measurement | Immigrants from Mexico | Immigrants from West Indies |
| Minimum | 4.4% | 3.7% |
| Maximum | 98.2% | 22.6% |
| Range | 93.8% | 18.9% |
| Mean | 24.6% | 12.6% |
| Median | 18.5% | 11.9% |
| Interquartile 25% (IQ1) | 15.4% | 8.2% |
| Interquartile 75% (IQ3) | 26.4% | 16.8% |
| Interquartile Range (IQR) | 11.0% | 8.6% |
| Standard Deviation (Sample) | 17.3% | 5.4% |
| Standard Deviation (Population) | 17.2% | 5.3% |
Similar Demographics by Poverty
Demographics Similar to Immigrants from Mexico by Poverty
In terms of poverty, the demographic groups most similar to Immigrants from Mexico are Immigrants from Guatemala (15.5%, a difference of 0.030%), Immigrants from Caribbean (15.5%, a difference of 0.090%), Creek (15.6%, a difference of 0.47%), African (15.6%, a difference of 0.54%), and Somali (15.4%, a difference of 0.57%).
| Demographics | Rating | Rank | Poverty |
| Immigrants | Bangladesh | 0.0 /100 | #297 | Tragic 15.3% |
| Immigrants | Senegal | 0.0 /100 | #298 | Tragic 15.3% |
| Senegalese | 0.0 /100 | #299 | Tragic 15.3% |
| Immigrants | Central America | 0.0 /100 | #300 | Tragic 15.4% |
| Bahamians | 0.0 /100 | #301 | Tragic 15.4% |
| Somalis | 0.0 /100 | #302 | Tragic 15.4% |
| Immigrants | Caribbean | 0.0 /100 | #303 | Tragic 15.5% |
| Immigrants | Mexico | 0.0 /100 | #304 | Tragic 15.5% |
| Immigrants | Guatemala | 0.0 /100 | #305 | Tragic 15.5% |
| Creek | 0.0 /100 | #306 | Tragic 15.6% |
| Africans | 0.0 /100 | #307 | Tragic 15.6% |
| Choctaw | 0.0 /100 | #308 | Tragic 15.6% |
| Seminole | 0.0 /100 | #309 | Tragic 15.6% |
| Dutch West Indians | 0.0 /100 | #310 | Tragic 15.6% |
| Chippewa | 0.0 /100 | #311 | Tragic 15.7% |
Demographics Similar to Immigrants from West Indies by Poverty
In terms of poverty, the demographic groups most similar to Immigrants from West Indies are Immigrants from Bahamas (14.8%, a difference of 0.0%), Barbadian (14.8%, a difference of 0.040%), Bangladeshi (14.8%, a difference of 0.060%), Belizean (14.8%, a difference of 0.080%), and Immigrants from St. Vincent and the Grenadines (14.9%, a difference of 0.37%).
| Demographics | Rating | Rank | Poverty |
| Sub-Saharan Africans | 0.1 /100 | #268 | Tragic 14.5% |
| Immigrants | Cuba | 0.1 /100 | #269 | Tragic 14.6% |
| Central Americans | 0.1 /100 | #270 | Tragic 14.6% |
| Shoshone | 0.0 /100 | #271 | Tragic 14.7% |
| Chickasaw | 0.0 /100 | #272 | Tragic 14.7% |
| Spanish Americans | 0.0 /100 | #273 | Tragic 14.7% |
| Barbadians | 0.0 /100 | #274 | Tragic 14.8% |
| Immigrants | West Indies | 0.0 /100 | #275 | Tragic 14.8% |
| Immigrants | Bahamas | 0.0 /100 | #276 | Tragic 14.8% |
| Bangladeshis | 0.0 /100 | #277 | Tragic 14.8% |
| Belizeans | 0.0 /100 | #278 | Tragic 14.8% |
| Immigrants | St. Vincent and the Grenadines | 0.0 /100 | #279 | Tragic 14.9% |
| Haitians | 0.0 /100 | #280 | Tragic 14.9% |
| Immigrants | Barbados | 0.0 /100 | #281 | Tragic 14.9% |
| Comanche | 0.0 /100 | #282 | Tragic 15.0% |